
27 October 2026 — early-session briefing (Asia/Karachi). This is a dated analysis using the latest internally usable 26 October market snapshots retrieved before publication. It is not a streaming quote or an executable premium signal.
1. Executive Summary
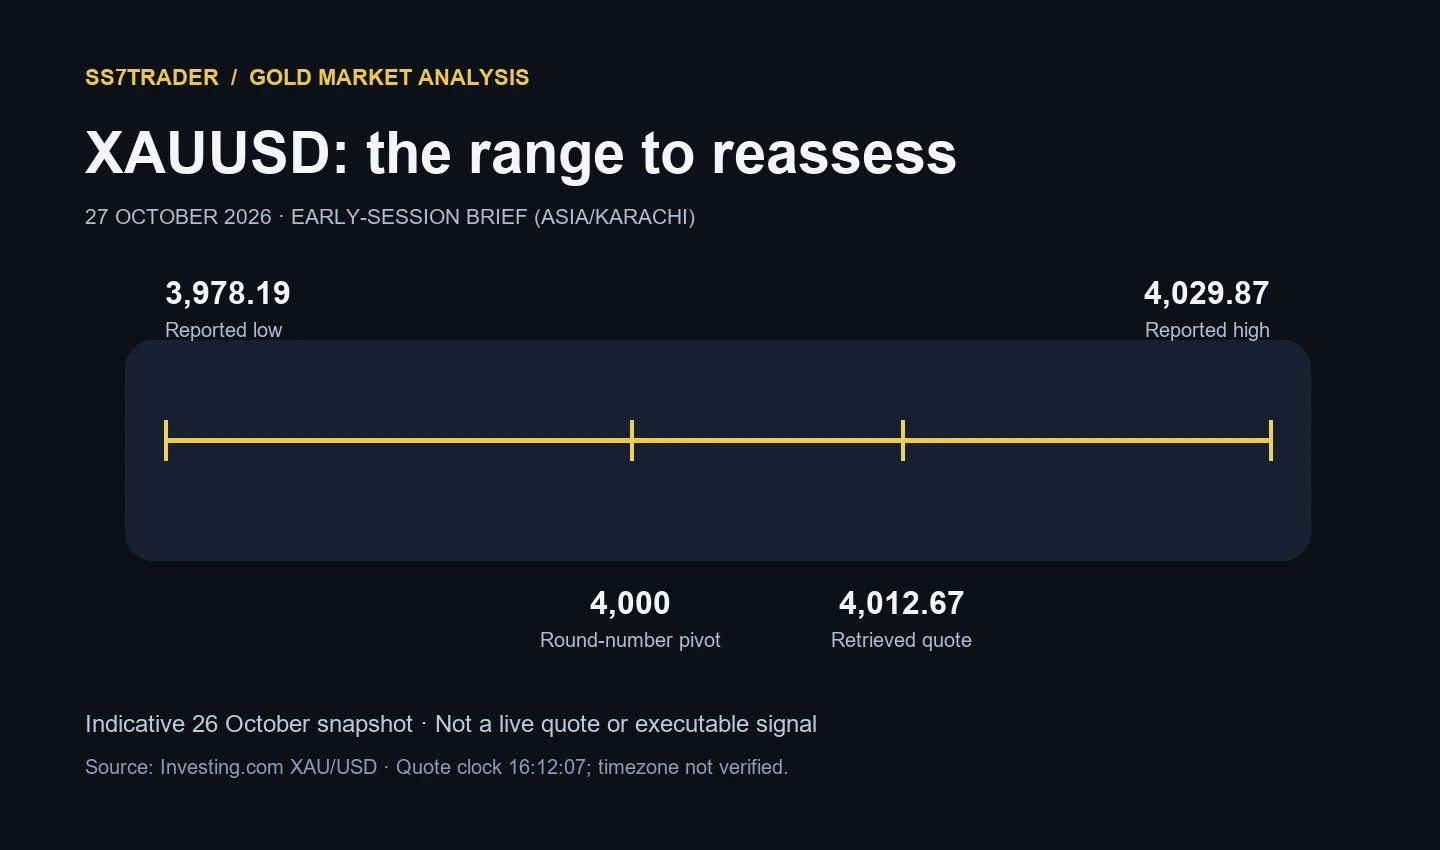
Our working Gold bias is range-bound with a cautious upside recovery: the retrieved XAU/USD quote was $4,012.67, up 0.43% against its source’s previous close, inside a reported $3,978.19–$4,029.87 session range. A sustained break of that range would carry more weight than a move within it, with the Federal Reserve meeting adding event sensitivity.
Data cut: the quote page displayed 16:12:07 without a confirmed timezone; the separate technical table was dated 26 October 2026, 19:48 GMT. These are reference snapshots, not synchronized live observations. The reported percentage is a session change, not an independently measured rolling 24-hour return. Sources: XAU/USD quote and technical snapshot.
2. Bullish Drivers
- Recovery within the observed range. A positive session change is constructive, but it does not establish a confirmed trend reversal. The useful next question is whether buyers can sustain acceptance above the range ceiling.
- Conditional technical confirmation. On an updated H1 chart, an RSI(14) hold above 50, improving MACD momentum and price acceptance above the 20-period moving average would strengthen a breakout case. These are conditions to check, not claims that all are already met.
- Potential macro relief. A softer dollar or falling real yields would make a bullish scenario more coherent. That relationship needs confirmation from current cross-market data; it should not be assumed from Gold’s price alone.
3. Bearish Drivers / Headwinds
- The recovery is still inside the range. Rejection near its upper edge would favour continued consolidation rather than immediate follow-through.
- Dollar pressure. The separately retrieved derived DXY page showed 102.03, up 0.22%, at its displayed clock of 16:30:01. This is a potential headwind, not a measured real-time correlation with Gold: the observations are not synchronized. DXY source.
- Policy uncertainty. The Fed calendar lists October 27–28; the ECB calendar lists October 28–29, with its press conference after day two. Neither decision has occurred at this briefing’s preparation time. This analysis does not assume an outcome.
Current real-yield data was not reliably verified for this briefing, so no numerical real-yield reading or observed yield/Gold correlation is asserted.
4. Key Technical Levels
| Area | Reference | How to read it |
|---|---|---|
| Immediate resistance / upside objective | $4,029–$4,030 | Rounded zone around the reported session high. |
| Pivot / inflection reference | $4,000 | Psychological round number selected for this scenario framework; not a calculated pivot. |
| Immediate support / downside boundary | $3,978–$3,980 | Rounded zone around the reported session low. |
| Extension references | $4,050 above; $3,950 below | Analyst-selected round-number objectives if a breakout develops; not verified swing levels or promised targets. |
These are areas to reassess on your own chart. A support zone is not automatically an appropriate stop-loss location: the trade’s invalidation structure, spread, volatility and position size determine whether the proposed risk makes sense.
5. Scenario Planning
Bullish breakout: acceptance, then follow-through
Trigger: an H1 close above the resistance zone, followed by a retest that holds rather than immediate rejection. Check the RSI, MACD and moving-average conditions described above on the same feed and timeframe. Objective: the upper extension reference. Failure: a return below the broken boundary without recovery would weaken the breakout thesis; do not treat a wick through resistance as confirmation.
Bearish breakdown: loss of the lower boundary
Trigger: an H1 close below the support zone and a failed attempt to reclaim it. RSI below 50, deteriorating MACD and price below the 20-period average would support this interpretation if verified at the decision time. Objective: the lower extension reference. Failure: a sustained reclaim of the broken boundary would challenge continuation.
Sideways / consolidation: neither boundary holds a break
If attempted breaks repeatedly return inside the reported range, retain a conditional range view. The middle of a range can offer poor separation between the entry idea and its invalidation. Waiting for clearer acceptance or rejection is a valid outcome; there is no requirement to turn every market update into a trade.
6. Risk Management & Invalidation
The range thesis should be reassessed after sustained H1 acceptance outside either boundary. Refresh the reference range and indicators before a later session; a dated snapshot loses usefulness as new prices develop. This is a scenario framework, not a claim that these exact levels will remain active throughout 27 October.
Before acting, calculate monetary exposure from your broker’s XAU/USD contract size, chosen volume and stop distance. Allow for spread and possible slippage; a stop order does not guarantee a specific fill during a gap or fast move. If the stop required by the setup exceeds your risk budget, reduce exposure or pass.
Central-bank headlines can invalidate a quiet-market setup quickly. Confirm event times in the official calendars and your own timezone. Do not label this briefing’s price, derived DXY observation or unverified indicator values as live execution data.
Follow the analysis and premium setups
Join t.me/ss7trader for SS7TRADER public updates. For the separate paid Forex, Gold and Crypto signal service, review the current offer at signal.ss7trader.com. A premium subscription and Thunder AI Forex & Gold are separate products.
Method: original conditional analysis of public snapshots and official policy calendars. Indicator thresholds are proposed confirmation criteria, not verified current readings. No live RSI/MACD value, synchronized macro correlation, guaranteed forecast or measured performance result is claimed.