
2–6 NOVEMBER 2026 / MULTI-ASSET WEEK AHEAD
The jobs report sets the macro test. Central banks and technology earnings decide how uneven the journey becomes.
Prepared 2 November 2026. This is a week-ahead scenario report, not a live signal feed. Events that have occurred by the time you read it must be assessed using their actual releases. Chart quotes update separately from this dated analysis.
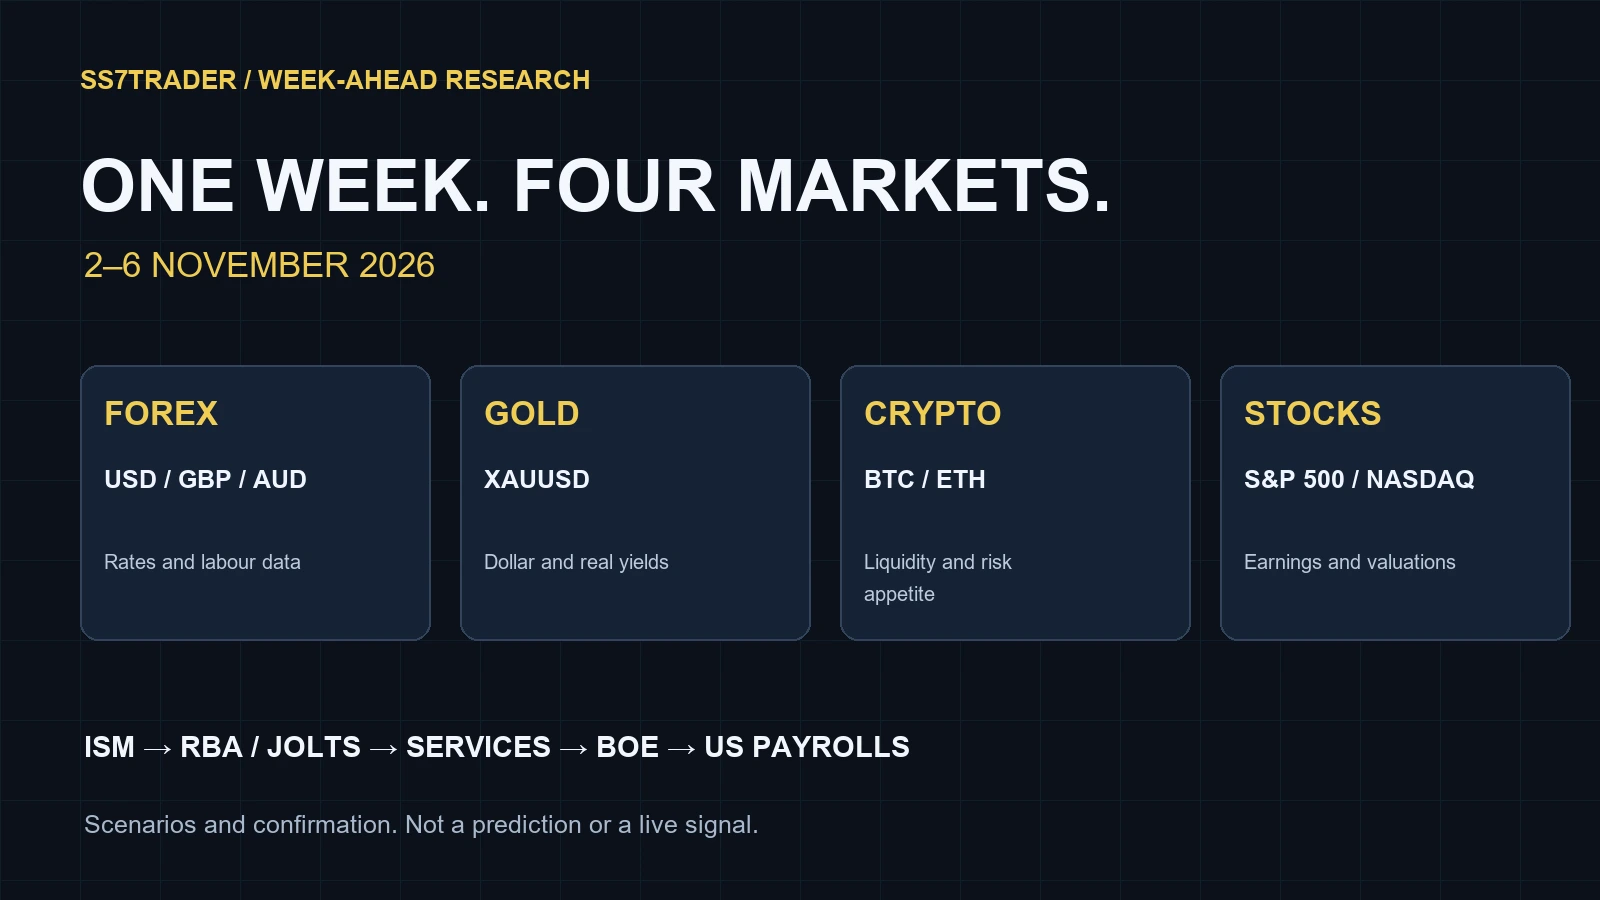
Executive summary: confirmation matters more than a confident headline
Our starting approach is selective rather than uniformly bullish or bearish. A firm dollar and rising yields would make sustained recoveries in Gold and rate-sensitive assets harder. Softer US data could relieve that pressure, but a serious growth scare could still hurt stocks and crypto. The distinction is whether markets price a manageable slowdown or deteriorating earnings and credit conditions.
Recent coverage points to the same broad tension. Independent Investor’s week-ahead preview puts labour data, central banks and technology results at the centre of the week. Associated Press reporting on the late-week sell-off describes pressure in technology and Bitcoin. Those are context observations, not a reason to assume every rebound must fail. Our scenarios below explain the conditions that would strengthen or weaken each view.
This week’s economic calendar
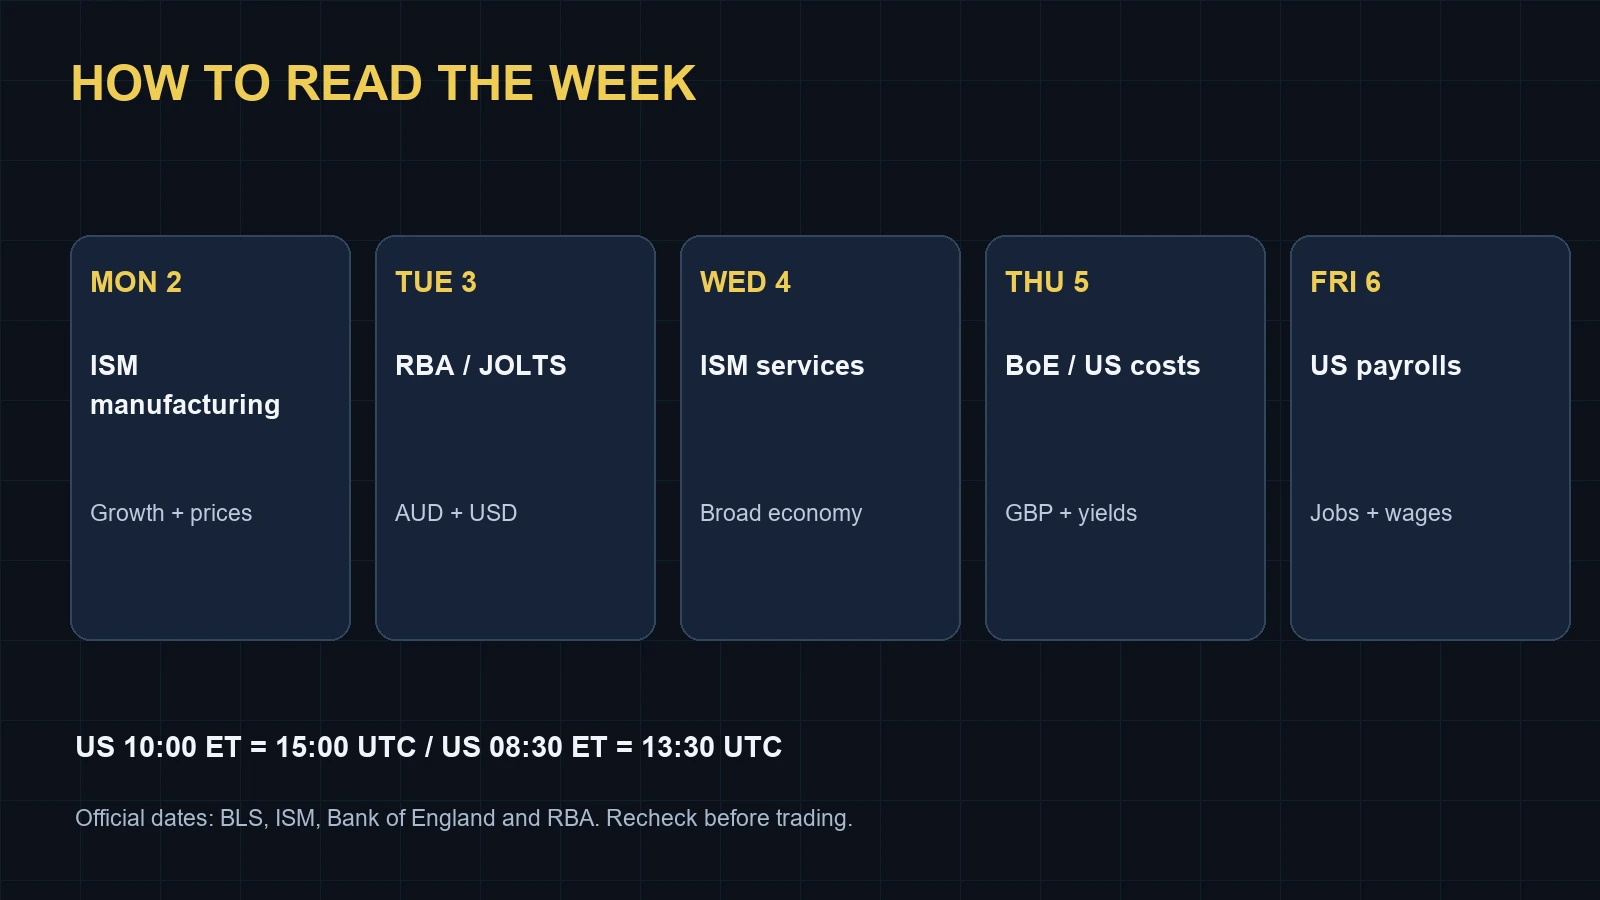
The dates below were checked against the BLS release calendar, ISM schedule, Bank of England notice and RBA board schedule. This selected calendar focuses on the releases most relevant to the charts in this report. Scheduled events are not released results, and no unverified numerical consensus is presented as fact.
| Date | Event | UTC / Pakistan | What to watch |
|---|---|---|---|
| Mon 2 Nov | US ISM manufacturing | 15:00 / 20:00 | New orders, employment and prices alongside the headline |
| Tue 3 Nov | RBA decision; US JOLTS | RBA: confirm release notice; JOLTS 15:00 / 20:00 | AUD policy guidance; September labour demand |
| Wed 4 Nov | US ISM services | 15:00 / 20:00 | Growth breadth and price pressure in the larger service economy |
| Thu 5 Nov | BoE decision; US productivity and costs | BoE 12:00 / 17:00; US 13:30 / 18:30 | GBP vote split and forecasts; unit labour costs |
| Fri 6 Nov | US October employment report | 13:30 / 18:30 | Payrolls, unemployment, wages and revisions together |
New York is on standard time this week: 08:30 ET is 13:30 UTC; 10:00 ET is 15:00 UTC. Pakistan remains UTC+5. The BoE notice specifies noon UK time. Recheck the calendar and release providers for changes.
What would surprise markets?
A strong payroll headline is not automatically positive for shares: it can improve the demand outlook while also lifting yields. Conversely, weak jobs growth is not automatically bullish for Gold and Bitcoin if investors seek dollar liquidity. Compare the release with the expectation visible immediately before publication, then inspect unemployment, wages and revisions. We deliberately avoid assigning a precise probability to either reaction.
Tuesday’s US election-related headlines add a separate policy and sentiment risk. Early results, projections and final outcomes are different stages. Treat an overnight gap as a fresh price discovery process rather than evidence that a pre-election position was correct.

Forex outlook: follow dollar breadth, then local catalysts
The dollar is the common factor across these pairs, but it should not erase the local story. Sterling faces its own policy decision; the Australian dollar has the RBA and risk sentiment; the Canadian dollar is sensitive to energy; the yen can react differently when risk aversion and yield changes pull in opposite directions.
EURUSD
Watch a recovery attempt against the latest lower high on the daily chart.
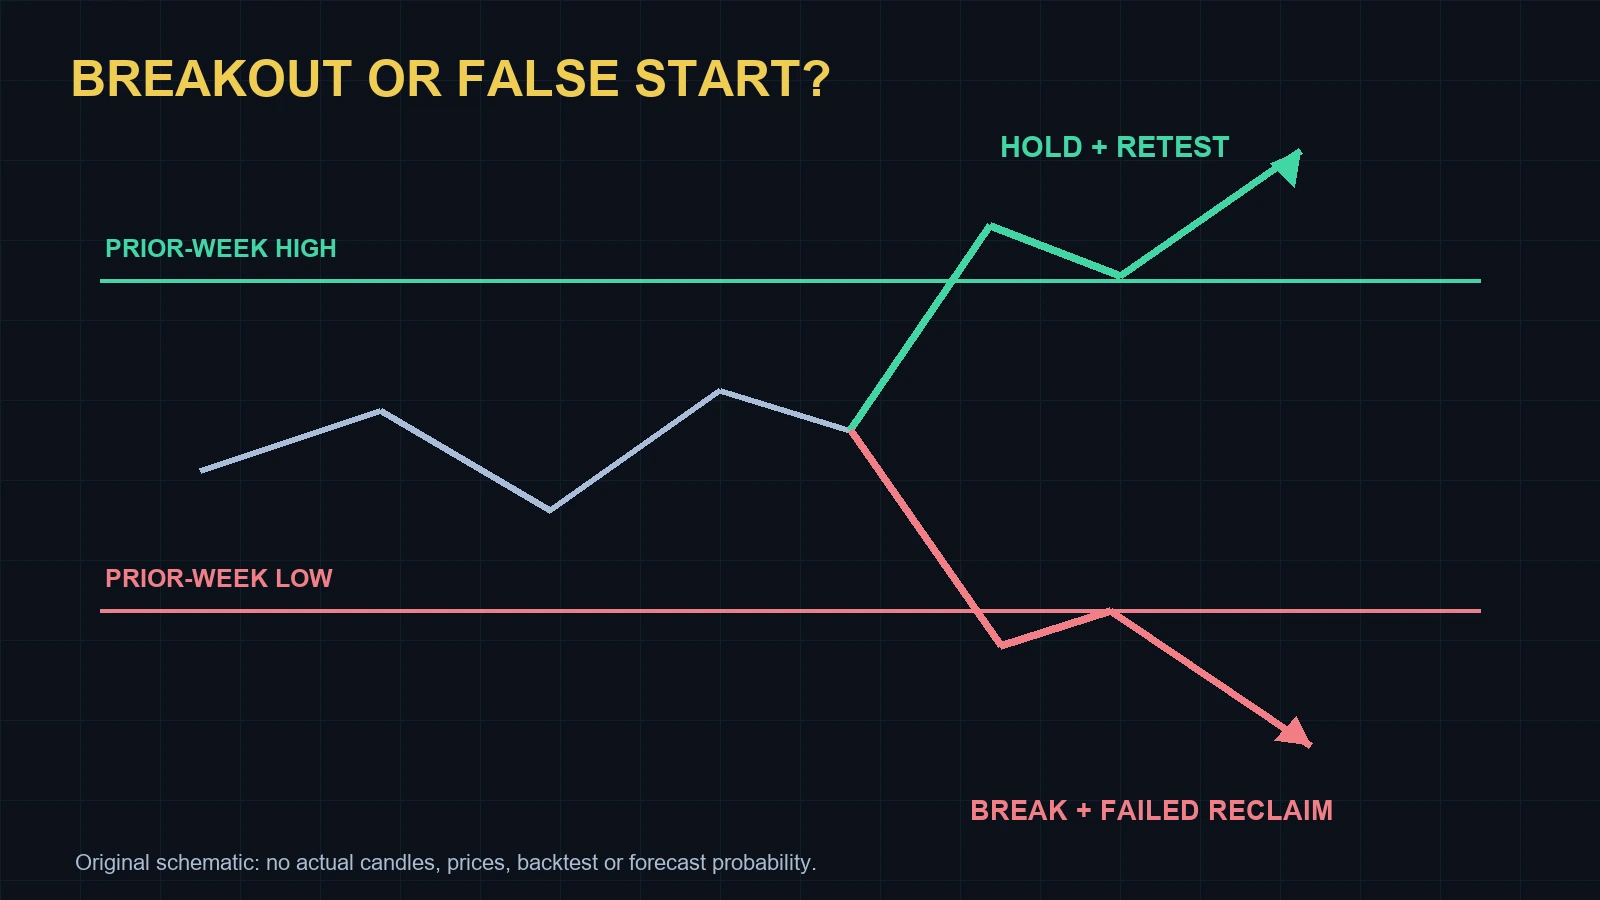
Bullish trigger: A four-hour close above the prior-week high, followed by a successful retest, would improve the recovery case if dollar strength fades.
Bearish trigger: A break of the prior-week low that cannot be reclaimed keeps downside continuation in focus.
Reassess: A return inside the broken range invalidates the immediate breakout thesis; do not keep calling it a trend entry.
GBPUSD
Separate the BoE announcement from the later US data reaction.
Bullish trigger: Sterling strength is more credible if UK yields and the post-decision range support it. A sustained break above that range can replace a bearish pre-event view.
Bearish trigger: A hawkish-looking headline can still fade if guidance disappoints. A failed rebound below the event high favours caution on longs.
Reassess: Rebuild the range after the policy release; a pre-meeting level can lose relevance quickly.
USDJPY
Watch US yields and risk demand for the yen together.
Bullish trigger: Higher US yields with a sustained break above the recent range would support an upside case.
Bearish trigger: Falling yields and a failed reclaim of the range floor would strengthen the downside alternative.
Reassess: A reversal in the rate spread or an abrupt yen-policy headline requires reassessment.
AUDUSD
The RBA decision is the early-week catalyst, not a standalone all-week signal.
Bullish trigger: A firmer policy message needs follow-through above the post-RBA range and stable risk appetite.
Bearish trigger: Rejection at that range with a stronger dollar would weaken any initial AUD rally.
Reassess: Friday’s US jobs report can overturn Tuesday’s interest-rate interpretation.
USDCAD
Check crude oil before assuming the pair is a pure dollar trade.
Bullish trigger: USD strength with oil weakness can reinforce a range breakout higher.
Bearish trigger: Broad USD selling or oil support for CAD would make a failed upside breakout important.
Reassess: If dollar and oil signals conflict, reduce confidence instead of forcing a directional forecast.
EURUSD · open interactive 4-hour chart
Chart by TradingView ↗. Quotes may be delayed and differ by venue. No SS7 proprietary indicator or forecast drawing is loaded in this public widget.
Published reference levels: use the date, not just the number
RoboForex’s 30 October forecast lists EURUSD support/resistance at 1.1048 / 1.1223, GBPUSD at 1.3140 / 1.3369, USDJPY at 157.44 / 158.96, AUDUSD at 0.6939 / 0.7067 and USDCAD at 1.3898 / 1.4184. These are that analyst’s dated references, not SS7 executable orders or verified current quotes. If the live chart has already moved through a reference, rebuild the map from the current structure.
Gold / XAUUSD: distinguish a relief rally from a trend repair
For Gold, monitor the dollar and inflation-adjusted yields alongside price. A softer dollar can help a recovery, but a bounce that cannot recover the latest daily lower high is different from a sustained trend reversal. Safe-haven demand can also interrupt the usual yield relationship.
Recovery scenario
Look for price to reclaim a broken four-hour swing level, retest it and hold. Confirmation improves if US yields ease and the dollar weakens across several pairs. The next daily swing high is the first reassessment area, rather than an automatic profit promise.
Continuation scenario
A failed bounce followed by a daily close below the prior-week low would keep sellers in control. A quick return above that low weakens the breakdown. The first release spike alone does not establish acceptance below support.
What invalidates the cautious view? A sequence of higher four-hour lows and a daily reclaim of the latest meaningful lower high. Mark those levels on the actual venue you trade; XAUUSD CFDs and exchange futures are different contracts.
Gold / XAUUSD · open interactive 4-hour chart
Chart by TradingView ↗. Quotes may be delayed and differ by venue. No SS7 proprietary indicator or forecast drawing is loaded in this public widget.
Silver and oil: useful confirmation, different drivers
Silver can follow precious-metal demand while also reacting to industrial-growth expectations. Compare a Gold breakout with Silver’s participation; disagreement is information, not proof of an imminent reversal. Oil is more exposed to supply headlines and inventories. An energy-price jump can support oil while worsening the inflation outlook for equities. For USDCAD, inspect both the oil move and the broader dollar before assigning a cause.
Bitcoin and Ethereum: separate market recovery from leverage noise
Bitcoin trades through the weekend, so Friday’s close is a reference, not Monday’s opening price. Recent security headlines add exchange-specific uncertainty. A price bounce does not establish that an operational issue is resolved; verify current platform announcements separately from your technical view.
Bitcoin / BTCUSD
Recovery: a reclaim of the most recent four-hour lower high, with spot participation and a successful retest, would improve the near-term picture. Check whether Nasdaq and broader risk sentiment support the move.
Failure: losing the prior-week low and failing to reclaim it would favour a defensive stance. A leverage-driven spike that instantly retraces is not the same as durable spot buying.
Ethereum / ETHUSD
Use ETHUSD and ETHBTC together. A dollar-price bounce with a weakening ETHBTC ratio can indicate that Bitcoin is doing most of the work.
Stronger case: ETH holds a higher low while relative strength stabilises. Weaker case: ETH loses its own weekly low and continues to underperform BTC. Avoid assuming that every altcoin will follow a Bitcoin rebound.
The linked 30 October broker forecast identifies Bitcoin’s 76,400–76,475 area and 79,607 as dated support/recovery references. They are not independently refreshed here. The chart below is the place to check whether those references still matter.
Bitcoin / BTCUSD · open interactive 4-hour chart
Chart by TradingView ↗. Quotes may be delayed and differ by venue. No SS7 proprietary indicator or forecast drawing is loaded in this public widget.
Open Ethereum chart ↗ · Compare ETH against BTC ↗
Spot versus futures changes the risk
A spot position and a leveraged perpetual contract do not carry the same liquidation risk. Around macro releases, inspect venue liquidity, funding and order size. A signal can identify a setup without guaranteeing a fill, and a stop instruction does not guarantee its execution price during a gap.
Stocks: S&P 500 breadth, Nasdaq leadership and earnings gaps
Start with the index, then inspect participation. A rising S&P 500 driven by a few large companies can be less robust than a recovery shared by multiple sectors. For the Nasdaq 100, compare the price response with yields and semiconductor performance. Company earnings can overwhelm a broad-market thesis for an individual stock.
S&P 500
Constructive: the index recovers a broken daily level, holds the retest and receives broader sector participation. Defensive: a rally fails at that level and the prior-week low breaks on a daily close.
Do not mix a cash-index level, a futures price and an ETF price. The chart below uses OANDA’s SPX500USD CFD as an index-tracking reference, not the official cash-index feed; its quotes and trading hours may differ. Feed details ↗
Nasdaq 100 and technology shares
Watch whether technology earnings produce follow-through after the opening gap. A headline beat followed by selling can mean expectations were higher than the reported result. A weak opening that recovers and holds can be more constructive than the headline suggests.
For a single company, compare guidance, margins and cash generation with expectations rather than treating EPS alone as the complete result.
S&P 500 CFD · OANDA · open interactive 4-hour chart
Chart by TradingView ↗. Quotes may be delayed and differ by venue. No SS7 proprietary indicator or forecast drawing is loaded in this public widget.
Company watchlist: AMD, Apple, Palantir, Arm and Qualcomm
AMD’s investor-relations calendar confirms results on Tuesday, 3 November. Semiconductor demand, management guidance and the price response are the key questions for both AMD and peers. Apple, Palantir, Arm and Qualcomm also appear in the week-ahead earnings preview; confirm each company’s latest IR notice before relying on its date. A secondary calendar is not a substitute for an issuer announcement.
For AMD and Nvidia, check whether a sector move is broad or concentrated in one issuer. For Apple, focus on consumer demand and forward guidance. For Palantir, compare growth expectations with valuation sensitivity. These are research questions, not recommendations to buy those shares ahead of results.
Nasdaq 100 chart ↗ · AMD chart ↗ · Apple chart ↗
Three cross-market outcomes to prepare for
| Outcome | Forex / Gold | Crypto / stocks | Confirmation |
|---|---|---|---|
| Resilient growth, persistent prices | USD/yields may stay supported; Gold may struggle | Earnings support can compete with valuation pressure | Observe actual yield and dollar response |
| Orderly slowdown, easing price pressure | Softer USD/yields may help Gold and EURUSD | Risk appetite may improve if earnings remain resilient | Higher lows and broader participation |
| Growth scare or fresh liquidity shock | Safe-haven flows can conflict; USD demand may rise | Stocks and leveraged crypto may face selling | Failed rebounds, wider spreads and broken weekly lows |
These relationships are conditional. Gold can rise with the dollar during stress, while stocks can fall after weak data even if yields decline. Track the observed combination rather than forcing every market into a single macro slogan.
A practical plan for the trading week
- Before the session: mark the previous week’s high/low, the current four-hour swing structure and the day’s event time. Check the chart symbol and timezone.
- Before the release: write down the expectation you are comparing with. Reassess position size if spreads or volatility increase.
- After the release: distinguish the first spike, the candle close and the retest. A return inside the range weakens the breakout premise.
- Before entry: specify invalidation and calculate exposure from that distance. Several USD-related positions may be one concentrated macro trade.
- After the trade: log the decision, execution and result. A winning example does not validate an entire system; a losing example does not by itself invalidate a disciplined process.
This report does not claim a current RSI reading, MACD crossover, moving-average value or precise win probability. Those require a timestamped calculation on the same feed and timeframe. The interactive charts let you inspect your chosen indicators without presenting invented readings as analysis.
Frequently asked questions
What is the biggest market event this week?
The scheduled US October employment report on Friday 6 November is the main cross-market data test. The BoE, RBA, ISM surveys and company results can still dominate individual sessions.
Will Gold rise after weak US jobs data?
Not necessarily. Lower yields can help Gold, but dollar demand, positioning and the nature of a growth scare also matter. Use the actual reaction and chart confirmation.
Can Bitcoin and stocks move in opposite directions?
Yes. Exchange-specific news, crypto leverage and ETF flows can separate Bitcoin from the broader equity move. Correlation is not a trading rule.
Are the TradingView charts live trading signals?
No. They are public charts with venue-dependent or delayed quotes. They do not load SS7 proprietary indicators or execute trades.
Is this a Forex, Gold and Crypto buy/sell recommendation?
No. It is a dated scenario framework. Confirm your own feed, execution conditions and invalidation before making a decision.
Where can I follow SS7TRADER updates?
Join t.me/ss7trader, contact @SSsevenTrader for setup questions, or review signal.ss7trader.com for the separate signals service.
Sources and editorial method
We compared published week-ahead commentary with primary release schedules. Company dates are identified separately from third-party expectations. Our trigger/retest framework is SS7TRADER interpretation; source price references are explicitly dated. No consensus figure or technical-indicator reading was invented.
- BLS: official November release calendar
- ISM: 2026 release dates
- BoE: 5 November publication notice
- RBA: 2026 board meetings
- AMD: official investor calendar
- Independent Investor: week-ahead context
- Associated Press: late-week market context
- RoboForex: dated 30 October technical references
- Federal Reserve: source photograph
Educational market commentary. Prices, calendars and platform availability can change. This dated article is not continuously updated; published signals, if any, belong to the separate service.