
Bitcoin technical analysis · 4 November 2026
Bitcoin is testing the foundation of its August recovery. If buyers lose that floor and cannot reclaim it, $65,000 becomes a scenario worth preparing for.
Chart captured 4 November 2026 at 08:02 UTC+5 (03:02 UTC). Reference price: 75,904.59 USDT on BINANCE:BTCUSDT, daily candles. The latest daily candle was still open. This report is a dated analysis; the screenshot does not update.
Could Bitcoin fall to $65,000?
At our capture, BTCUSDT was already trading beneath $76,000 intraday. That puts pressure on the local floor, but an unfinished daily candle is not a confirmed daily or weekly breakdown. The useful question is whether buyers can recover the area before the close and defend it on a subsequent test.
Our bias is cautious while price remains under the recent lower highs. We would become more defensive after a sustained support failure and failed reclaim. We would reduce conviction in the downside case if price recovers the floor, builds a higher low and retakes the nearest overhead resistance.
What exactly is at risk of breaking?
The daily screenshot shows a strong August advance from the earlier $63,000–$66,000 trading area, followed by consolidation and an October rally toward $87,000. That rally has since unwound into a sequence of lower swing highs and a return toward the September support region.
The structure under discussion is the post-August recovery base. It is not Bitcoin’s first-ever historical structure break: the same screenshot includes a substantial earlier decline. Naming the timeframe and the swing being tested makes the analysis more useful than claiming an unprecedented event.
A support band is an area of previous buying interest, not a guaranteed barrier. Repeated tests can absorb resting demand, but they can also attract new buyers. Price acceptance below the zone, rather than the number of tests alone, is what would strengthen the bearish interpretation.
Bitcoin TradingView chart: support, recovery and the downside path
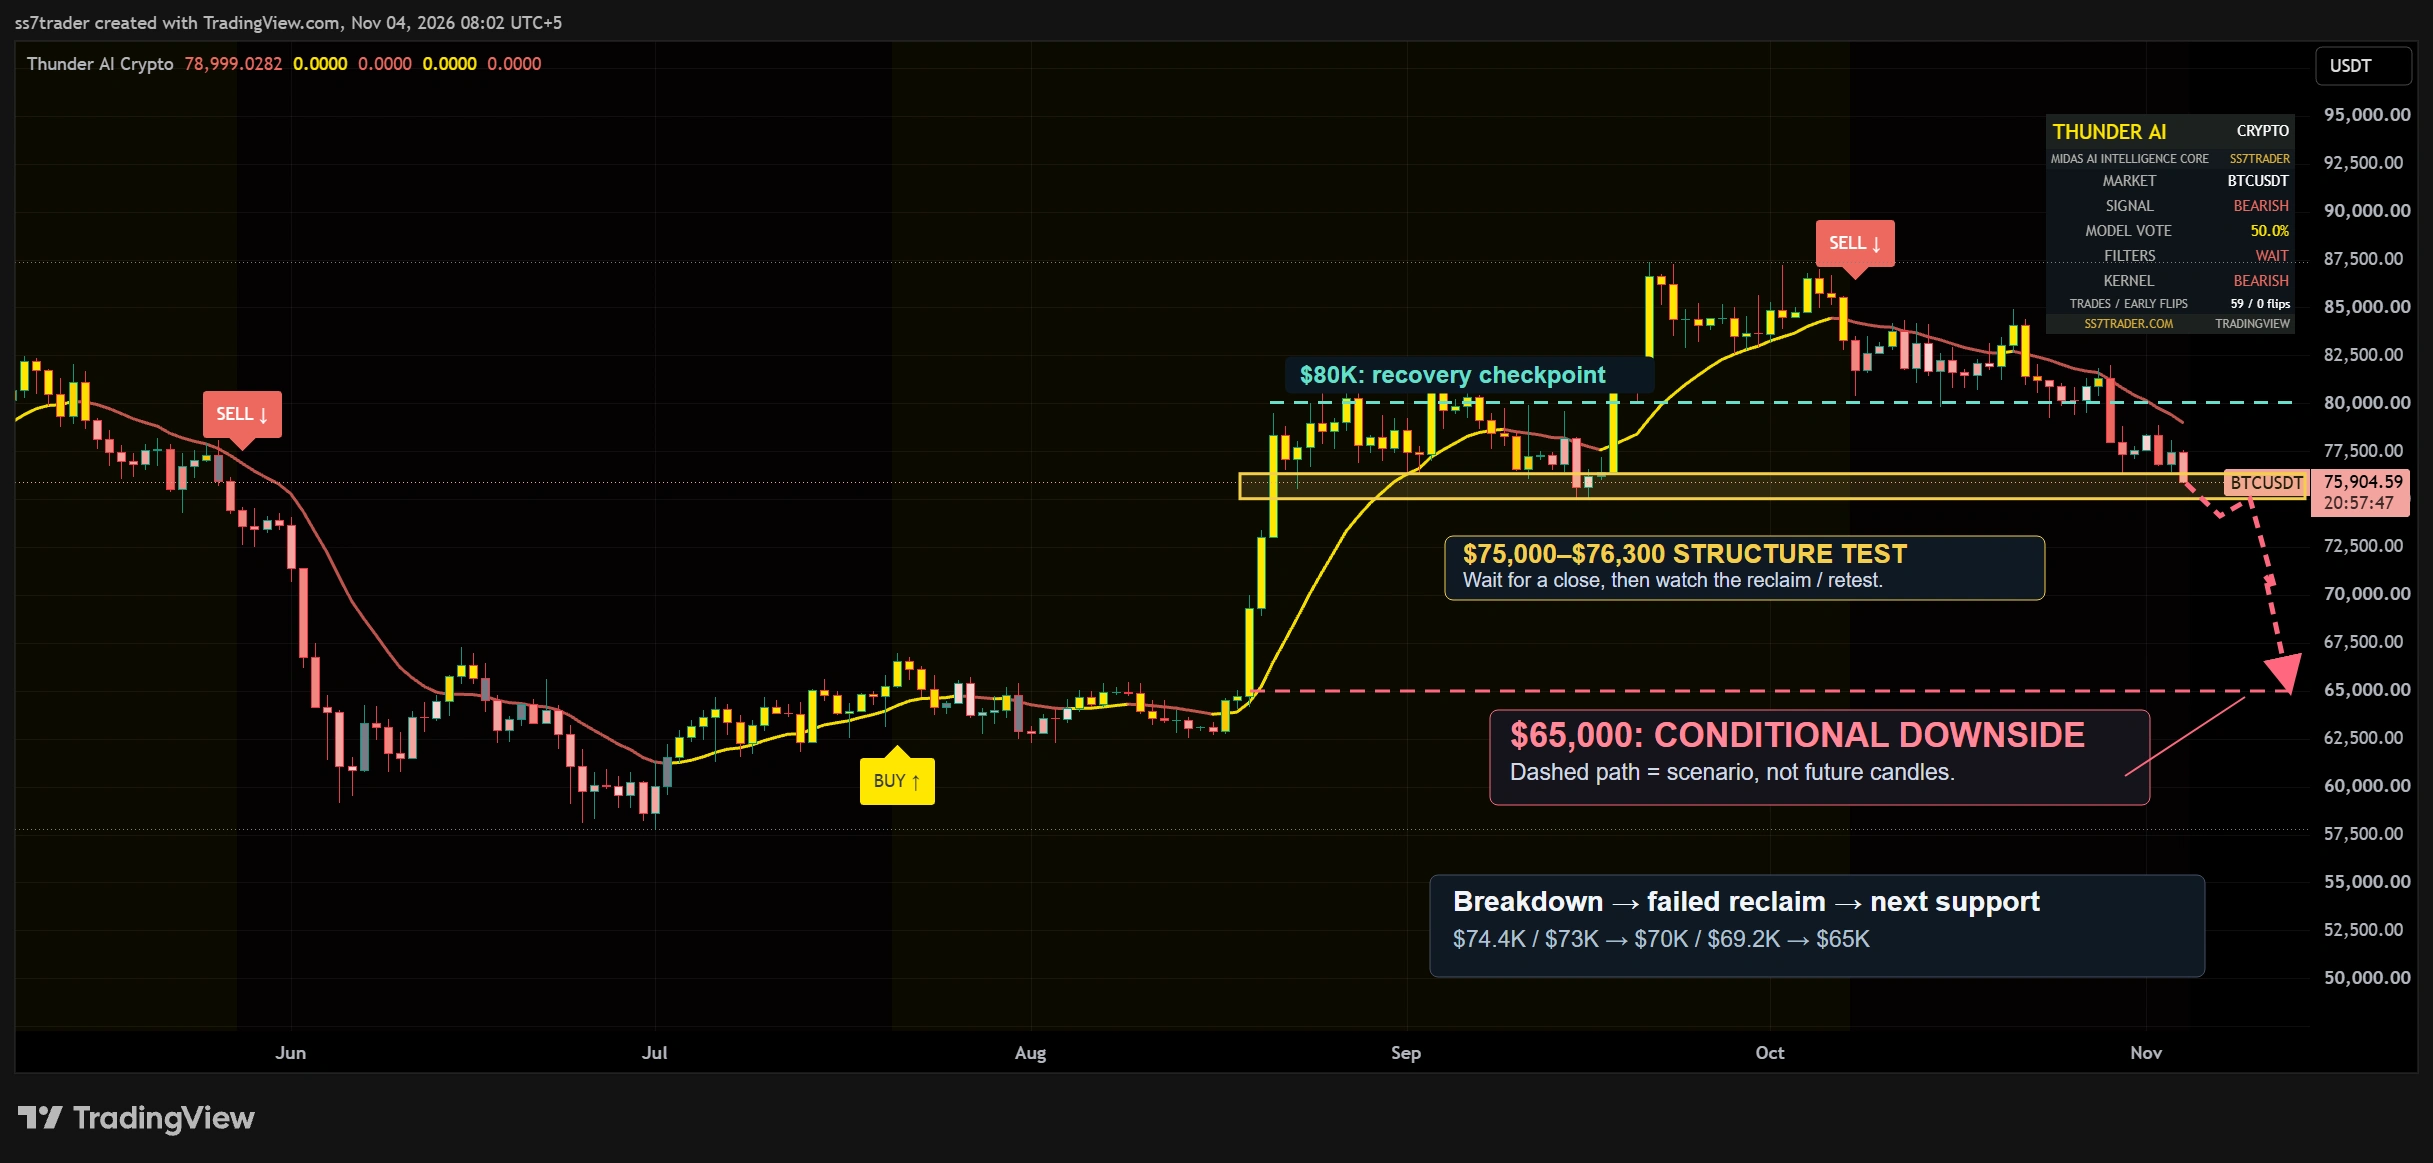
Read the drawing from the support zone outward. A move beneath the band is the first test; failure to recover it is the second. The dashed route then passes through lower support areas before reaching $65,000. It is deliberately not drawn as future candlesticks, because neither the timing nor the shape of a possible decline is known.
The chart also contains the owner’s Thunder AI Crypto overlay. Its kernel line, signal labels and dashboard are indicator output, separate from our support-zone drawings. The large 78,999.0282 legend value is the indicator’s kernel reading, not the captured BTC price. A model-vote percentage is not a win rate, and this screenshot alone is not a verified performance record.
What are analysts saying?
The commentary we reviewed does not establish a unanimous $65,000 target. It describes a market at an important support test, with both continuation and recovery arguments. Here are the dated views that matter for this setup:
Michael Boutros · FOREX.com · 30 October
Support failure could extend the correction
Boutros highlighted a pivot around $76,159–$76,560 and the importance of weekly confirmation. His lower reference areas included $74,434, an approximately $73,116 200-day average at that date, and $70,283–$70,531 / $69,243. His analysis also allowed for selling exhaustion near support. Read the original forecast ↗
Rekt Capital · reported by Cointelegraph · 2 November
A downside deviation could still recover
Cointelegraph reported Rekt Capital’s comparison with an earlier recovery pattern: the recent low near $76,300 was being treated as right-shoulder support, and a temporary move below it could remain part of a recovery setup. This is a pattern analogy, not proof that history must repeat. Read the report ↗
Chris Sullivan · reported by CoinDesk · 2 November
Positioning could fuel a rebound
Hyperion Decimus CEO Chris Sullivan described potential support from exchange withdrawals and short positioning, while stressing that the 200-day average needed to hold on further weakness. Those flows can support a squeeze, but do not automatically resolve an immediate chart breakdown. Read CoinDesk’s coverage ↗
James Stanley · FOREX.com · 7 October
$75,000 was an earlier structural marker
In an earlier analysis, Stanley treated $75,000 as an important invalidation area for the then-prevailing bullish structure and warned that losing it could deepen the decline. This is historical context from October, not a fresh November signal or an endorsement of our $65,000 projection. Read the dated analysis ↗
SS7TRADER interpretation: the common decision point is how price behaves around support. A clean breakdown and a rapid reclaim have very different implications. Our $65,000 scenario extends that structure analysis; it should not be attributed to all the analysts above.
Why $65,000 is a scenario—not a magic number
There are two reasons to keep the $65,000 area on a deeper-downside map. First, it sits inside the earlier trading region visible before August’s acceleration. Second, a rough range-height projection produces a nearby number if the approximately $76,000 floor fails.
$76,000 − $11,000 ≈ $65,000Illustrative range-height projection using rounded chart boundaries. Different choices of swing points change the projection.
A measured move is a planning technique, not a probability estimate. The market can stop at an intermediate level, squeeze higher after a false break, or move beyond the projection. From the captured 75,904.59 USDT reference, a move to 65,000 would be approximately 14.4% lower. That distance is substantial enough that the path and confirmation matter more than a dramatic headline.
The chart is quoted in USDT. Dollar-denominated levels in the discussion are rounded trading references; BTCUSD prices on other venues can differ. A $65,000 zone on one feed should not be treated as a precision order level on another.
BTC support and resistance levels to monitor
| Area | Role in this analysis | What would matter |
|---|---|---|
| $75,000–$76,300 | Immediate recovery-structure test | Daily / weekly acceptance below, or a reclaim followed by a higher low |
| $74,400–$73,000 | Next downside checkpoint | Whether a break extends or buyers absorb selling; rounded from the dated analyst map |
| $70,500–$69,200 | Deeper reaction zone | A pause or recovery here can prevent the $65K extension |
| Approximately $65,000 | Extended downside scenario | Relevant after the higher support areas fail, not an automatic destination |
| $79,400–$80,000 | First material recovery checkpoint | Sustained recovery would weaken the immediate downside continuation case |
| Approximately $81,400 | Higher resistance reference | A daily reclaim and held retest would force a wider reassessment |
These are zones for chart review, not entry instructions or fixed stop-loss levels. Analyst moving-average values above are dated to their reports; we have not represented them as recalculated readings for 4 November.
Three scenarios: breakdown, false break or consolidation
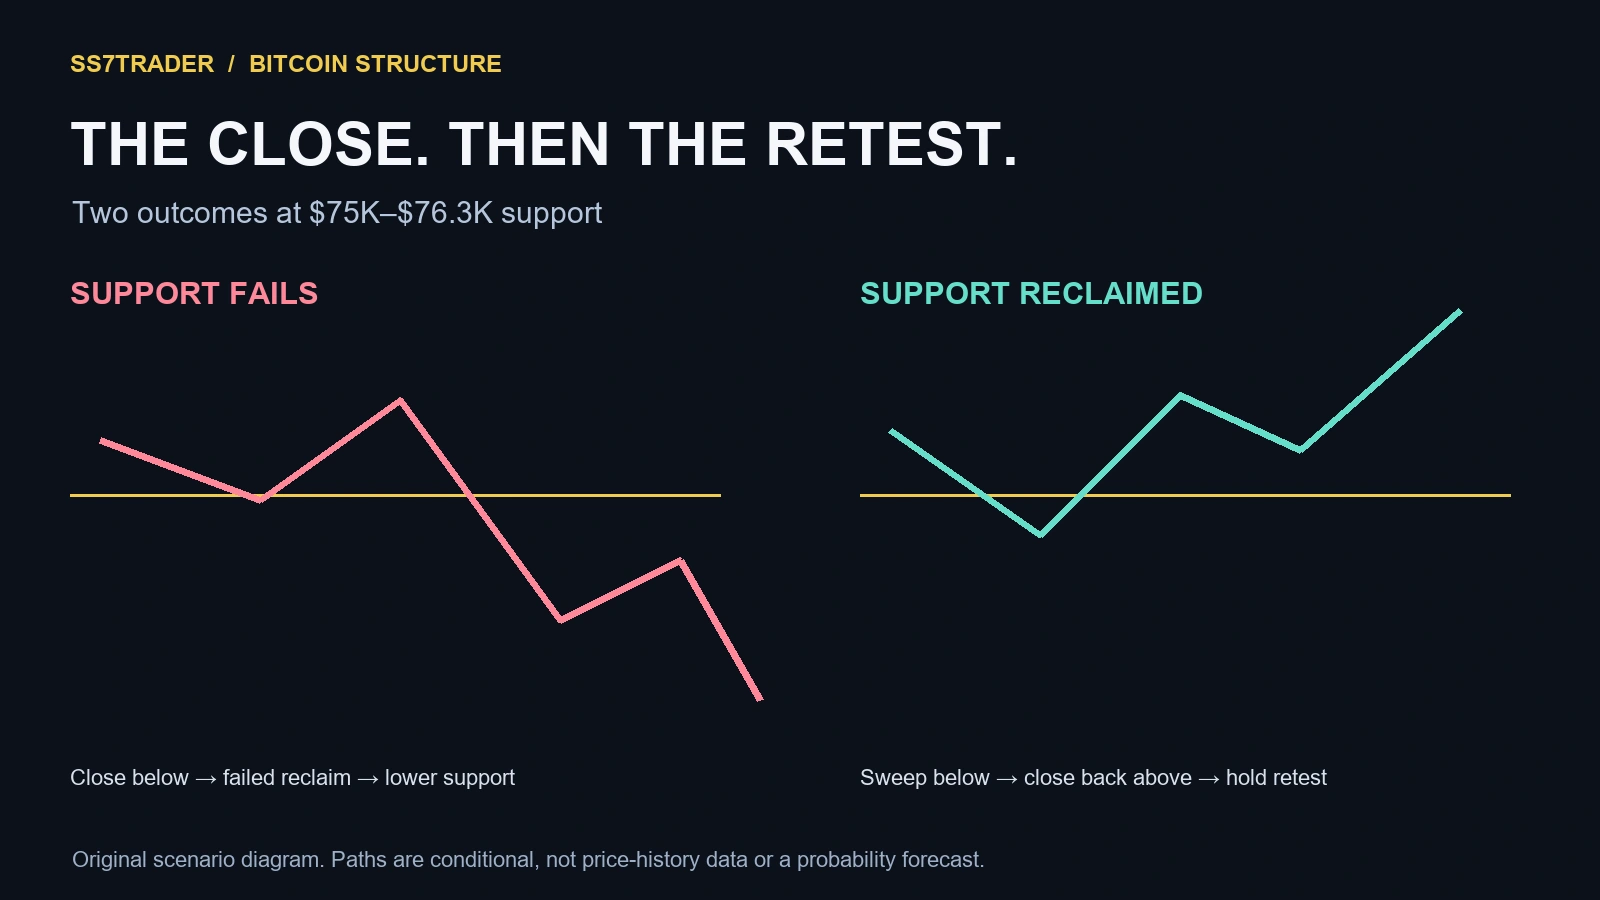
1. Bearish continuation: close below, then fail to recover
The bearish case gains weight if daily closes establish price below the support band, a rebound fails beneath it, and the next lower swing low breaks. Weekly confirmation would be more meaningful for a multi-week $65,000 thesis than a single intraday wick. Review $74,400–$73,000 first, followed by $70,500–$69,200; do not skip these areas in order to focus only on the furthest target.
2. False breakdown: sweep, reclaim and hold
If price trades below support but closes back above it, then holds the retest and forms a higher low, the breakdown thesis weakens. A subsequent recovery through $79,400–$80,000 would strengthen that improvement. The invalidation of a particular short setup depends on its own timeframe and swing structure; it cannot be inferred from a single universal stop price.
3. Consolidation: no decisive acceptance either way
Price may keep rotating around the support band without clear follow-through. In that case, a directional article is a watchlist rather than an execution plan. Wait for the range to resolve instead of repeatedly entering on alternating candles.
What could accelerate—or interrupt—the move?
Track the dollar, Treasury yields, technology stocks and crypto positioning together. Firmer yields and a stronger dollar can pressure speculative demand. However, softer economic data is not automatically bullish: a growth scare can still trigger selling across risk assets. A crowded short trade can also generate a sharp rally if price begins to recover.
Cointelegraph’s 3 November market report described Bitcoin retaining local lows around $76,300 while traders assessed the US midterms. The important distinction for this article is between that reported market state and our later 4 November chart capture below $76,000. Read the 3 November report.
The official BLS calendar schedules the October employment report for Friday, 6 November, at 08:30 Eastern Time (13:30 UTC). Jobs, wages and the actual market reaction can change the balance of risk. That is a scheduled release, not data that is already known.
For ongoing context, use our weekly Forex, Gold, Crypto and Stocks outlook, the economic calendar and market sessions tool.
Inspect the chart as conditions change
Public chart by TradingView. It updates independently of this dated article. The widget does not load our screenshot annotations or the proprietary Thunder AI indicator.
A practical checklist before acting on the $65K thesis
- Match the timeframe: the structural thesis uses daily and weekly evidence. A five-minute move alone does not validate it.
- Separate a wick from acceptance: record whether support is recovered before the close and whether the next retest holds.
- Define invalidation first: use the relevant swing and your execution conditions to calculate exposure, rather than choosing a large target and improvising risk later.
- For spot holders: review concentration and time horizon; a downside scenario does not mean a full exit is appropriate for everyone.
- For futures traders: leverage, funding, spread and liquidation distance can overwhelm a correct directional view. A stop order does not guarantee its execution price.
- Reassess at each level: do not keep the original bearish story after price clearly invalidates it.
The strongest takeaway is a sequence: support test → close → reclaim or failure → reassessment at the next level. That is more actionable than pretending a distant number is certain.
Bitcoin $65,000 scenario: frequently asked questions
Is Bitcoin definitely going to $65,000?
No. $65,000 is an extended downside scenario if the recovery structure fails and intervening support breaks. A reclaim of support can weaken or invalidate that path.
Has Bitcoin’s daily structure already broken?
At the 4 November capture, price was below $76,000 intraday, but the daily candle was open. A stronger structural conclusion needs completed candles and evidence of acceptance below the support zone.
What would weaken the bearish Bitcoin outlook?
A sustained reclaim of $75,000–$76,300, a held retest and higher low, followed by recovery through $79,400–$80,000, would weaken immediate downside continuation.
Do all analysts predict a $65,000 Bitcoin price?
No. The reviewed analysts discuss support failure, possible exhaustion and rebound conditions. The rounded $65,000 range-height scenario is SS7TRADER’s interpretation, not a consensus target.
Is the red dashed chart path a forecast with a deadline?
No. It is an explanatory drawing. It provides neither future candles, a time target nor a probability. The screenshot shows historical market data only up to its capture time.
Where can I follow SS7TRADER crypto updates?
Join t.me/ss7trader, explore Thunder AI Crypto for TradingView, or review our signals platform.
Sources and research method
Prepared by the SS7TRADER Research Team using a genuine TradingView chart capture and dated external commentary. Support-zone drawings, the range-height calculation and the scenario checklist are our interpretation. Commentary is attributed as direct publication or secondary reporting, not presented as an analyst interview conducted by SS7TRADER.
- TradingView — BINANCE:BTCUSDT daily chart; captured 4 November 2026, 03:02 UTC.
- Michael Boutros, FOREX.com — Bitcoin critical support forecast, 30 October 2026.
- James Stanley, FOREX.com — familiar support and BTC structure, 7 October 2026.
- William Suberg, Cointelegraph — weekly structure and Rekt Capital commentary, 2 November 2026.
- Helene Braun, CoinDesk — positioning and Chris Sullivan commentary, 2 November 2026.
- Cointelegraph — Bitcoin’s $76K support and midterm context, 3 November 2026.
- BLS — official November release schedule.
Educational market commentary, not a guaranteed prediction or personal recommendation. Analysis can become outdated as new candles and news arrive.