

Gold / XAUUSD · Thursday, 5 November 2026
Gold has recovered sharply from its late-October lows. The next question is whether buyers can hold the reclaimed ground—not simply whether the last candle was green.
Research snapshot: 5 November 2026, 06:53 UTC / 11:53 UTC+5. Reference: OANDA:XAUUSD, 4-hour chart, $4,126.140 at capture. The latest candle was open. This is a dated report, not a streaming quote; broker feeds can differ.
OANDA · 4H · 06:53 UTC
Approximate resistance zone
Payrolls, wages and unemployment
01 / Executive summary
A bullish recovery inside a bigger repair job.
The four-hour chart shows a fast rebound from the area around $3,870 into the low $4,100s. That is meaningful momentum, but the preceding decline from September and October has not vanished: buyers still face overhead supply left by earlier consolidations.
We therefore separate recovery momentum from a confirmed broader trend reversal. The former is visible in the captured chart. The latter needs a stronger sequence of higher lows, reclaimed resistance and sustained closes. Friday’s US jobs report can either reinforce that sequence or disrupt it.
02 / Price structure
The actual chart behind the view.
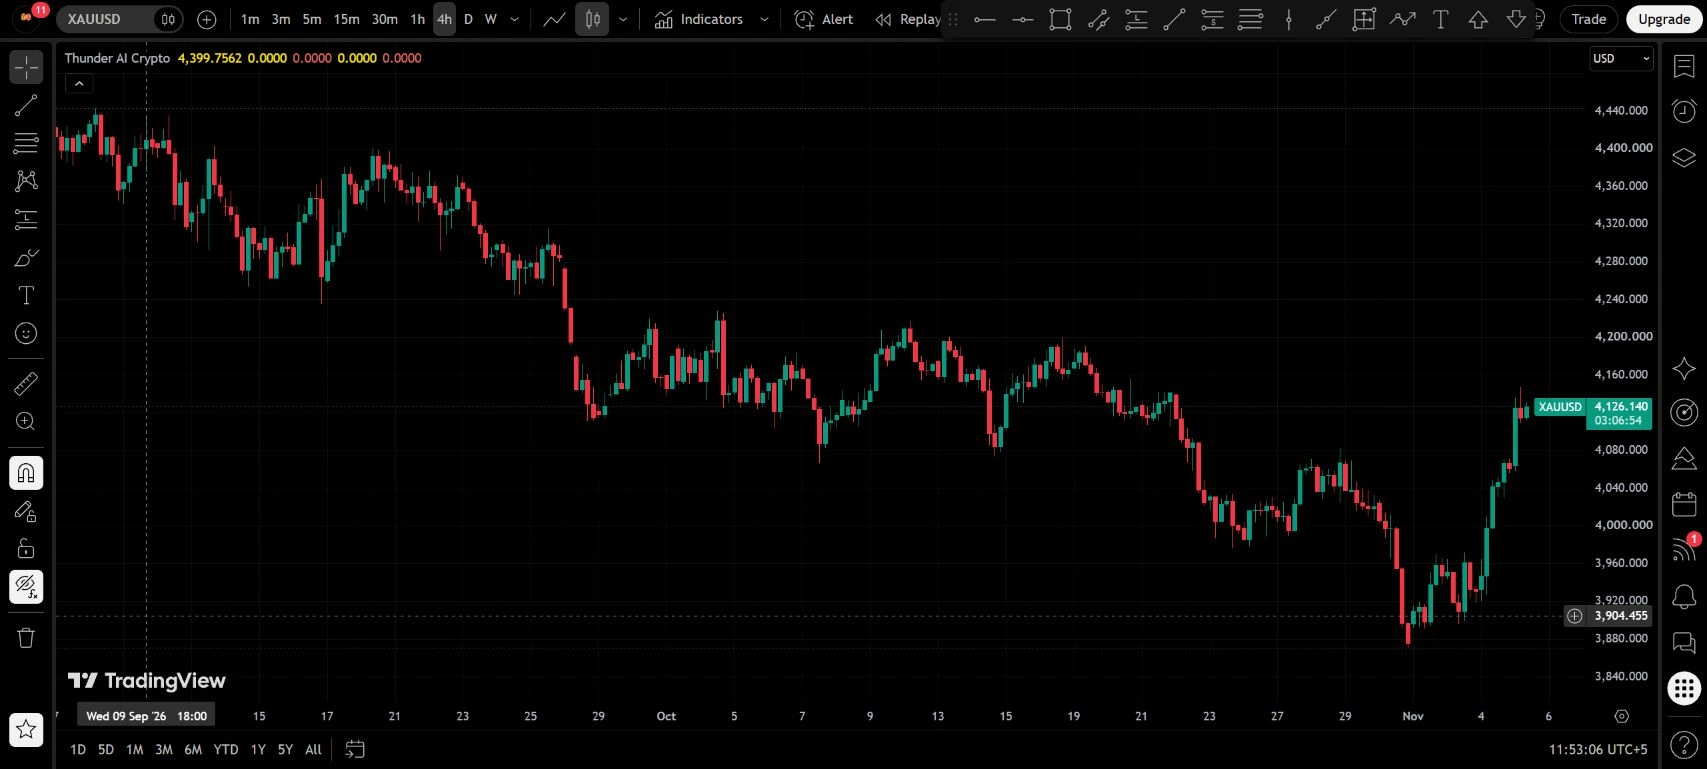
Read this chart in three stages. First, a sustained decline created repeated lower highs. Second, the late-October sell-off pushed gold into the high $3,800s. Third, this week’s recovery accelerated through $4,000 and the recent $4,060–4,075 area. That final area is now a useful test of whether buyers can defend a higher base.
The $4,145–4,150 zone brackets the latest session high visible in the source checks, approximately $4,147. Above it, the chart’s earlier swings make $4,200–4,220 the next area to assess. These are approximate zones derived from the chart, not exchange orders, measured institutional positions or guaranteed turning points.
03 / Fundamental context
What is supporting gold—and what could stop it?
Dollar weakness and fiscal uncertainty
Reuters’ 4 November reporting linked gold’s strong advance to a weaker dollar after the US midterm election outcome. A falling dollar can make dollar-priced bullion less expensive for overseas buyers. Fiscal-policy uncertainty can also increase demand for portfolio hedges. Reuters report via MarketScreener.
That explains an important part of the move already observed; it does not establish that election news will keep lifting gold indefinitely. The follow-through matters: if the dollar stabilises and yields rise after new data, the initial impulse can weaken.
Institutional demand supports the backdrop, not a precise entry
The World Gold Council’s 3 November release reported 321 tonnes of net central-bank purchases and 211 tonnes of physically backed ETF inflows in Q3. At the same time, jewellery volumes and bar-and-coin demand weakened. These figures describe a mixed demand picture rather than universal buying strength. Source: World Gold Council, Q3 2026 release.
The Council’s outlook also identifies competing forces: investment demand and fiscal uncertainty can support gold, while higher interest rates, bond yields and a stronger dollar can weigh on it. Central-bank buying should not be treated as a guaranteed floor under today’s chart. World Gold Council outlook.
04 / Technical reference map
The levels that change the argument.
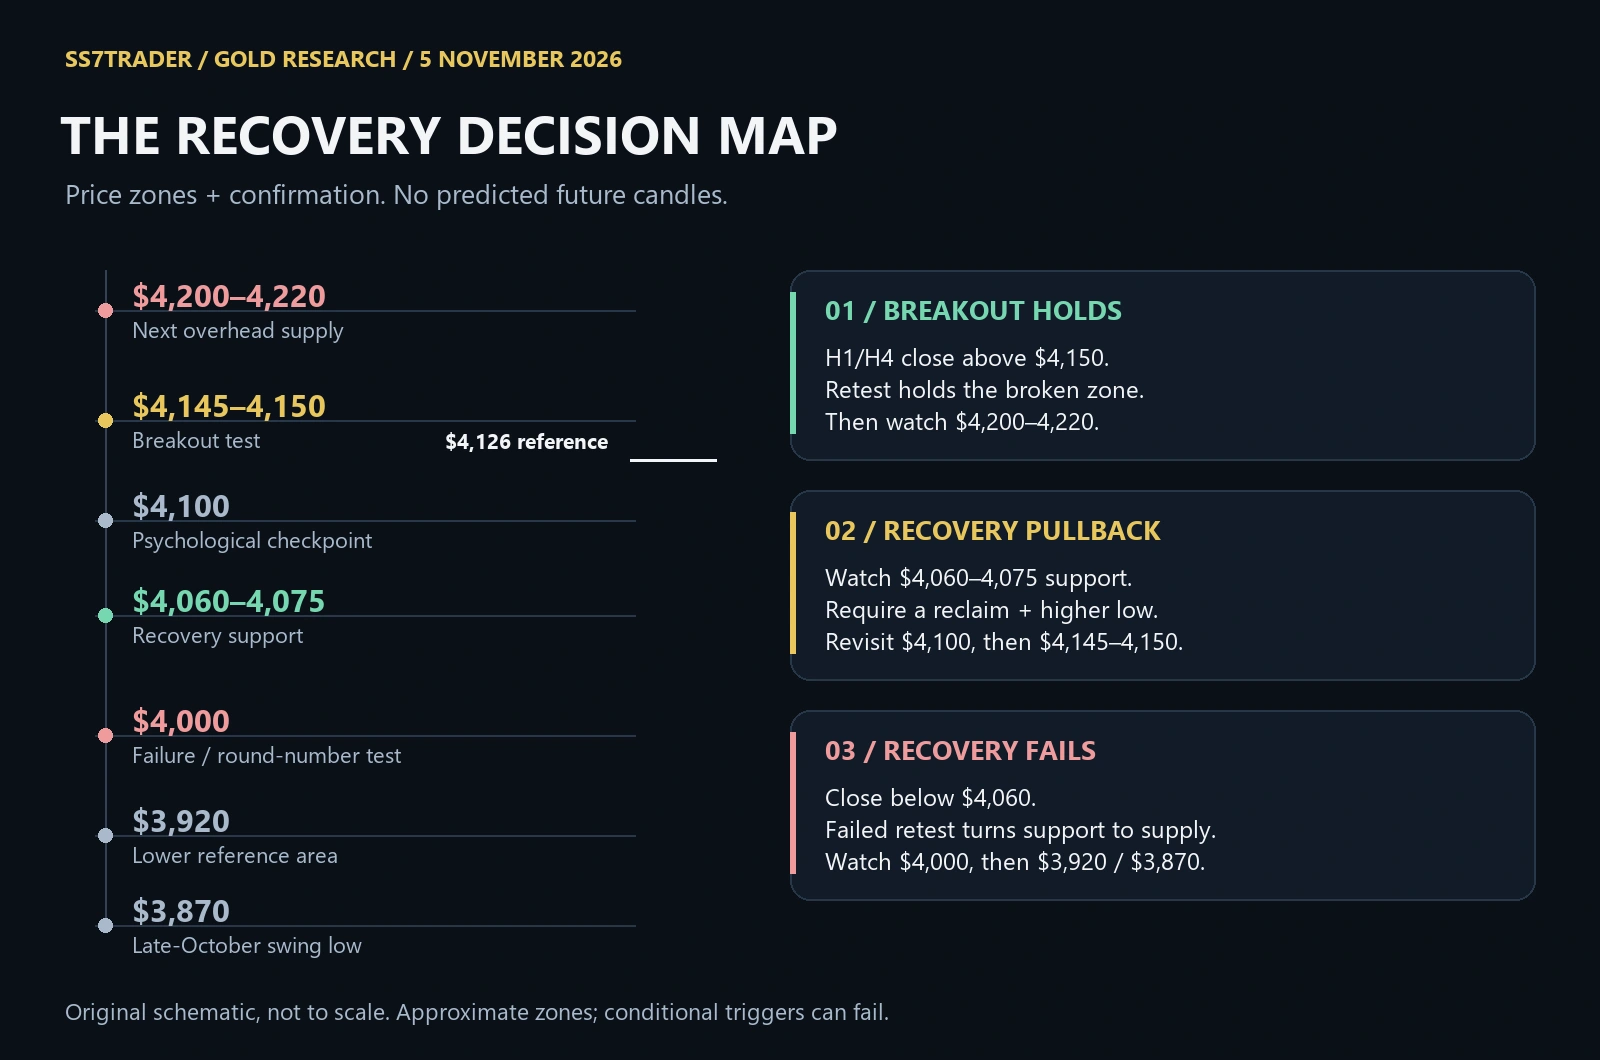
| Zone / USD per ounce | Why it matters | Confirmation to watch |
|---|---|---|
| $4,200–4,220 | Prior four-hour swing supply | Whether a breakout can sustain acceptance, rather than leave an upper rejection wick. |
| $4,145–4,150 | Immediate resistance around the checked session high | H1/H4 close above, then a retest that holds. |
| $4,100 | Round-number checkpoint within the rebound | A higher low above it helps momentum; loss of it increases the chance of a deeper pullback. |
| $4,060–4,075 | Reclaimed recovery area / working bias pivot | Defence supports the recovery thesis. A close below plus failed reclaim weakens it. |
| $4,000 | Major psychological level and recent recovery threshold | A sustained loss would undermine the rebound more seriously. |
| $3,920 / $3,870 | Lower reference area and late-October swing-low region | Relevant only if intervening supports fail; not immediate targets while recovery support holds. |
SS7TRADER chart interpretation, not quoted bank targets. Zone boundaries are deliberately rounded to accommodate feed differences. We do not claim a current RSI, MACD or moving-average reading because those studies were not measured on this captured chart.
05 / Economic event risk
Friday’s payrolls can test the recovery.
The BLS schedules the October Employment Situation for Friday, 6 November at 08:30 Eastern / 13:30 UTC. Thursday’s preliminary Q3 Productivity and Costs release is also scheduled for 08:30 Eastern. These are scheduled events at this report’s morning cutoff, not results already released. Official BLS schedule.
| Event | UTC / New York | Reference expectation | Gold interpretation |
|---|---|---|---|
| Thu 5 Nov: Q3 Productivity and Costs; weekly claims | 13:30 / 08:30 EST | TD’s 30 October calendar lists prior claims at 194K; it leaves the claims forecast blank. | Watch labour-cost pressure and whether the dollar/yields confirm the initial move. |
| Fri 6 Nov: October payrolls | 13:30 / 08:30 EST | TD calendar consensus snapshot: +65K, versus +29K previously. | A material downside surprise can help gold if yields fall; a strong surprise can challenge it. |
| Fri 6 Nov: wages and unemployment | Same release | TD snapshot: earnings +0.3% m/m; unemployment 4.2%. | Hot wages can offset a soft payroll headline. Read revisions and joblessness together. |
Forecasts above are the dated consensus figures in TD Economics’ 30 October calendar, not an assertion of the latest market consensus or TD’s own house forecast. Expectations may change before release. Recheck the calendar before trading.
Before the release: positioning can dominate
Gold may consolidate, reverse an early breakout or sweep nearby highs and lows as traders reduce exposure. A pre-release move is not proof that someone knows the payroll number. Thin liquidity and changing positioning can produce a similar pattern.
After the release: the second move can matter more
Compare the headline, wages, unemployment and revisions with expectations, then watch the dollar and Treasury yields. A weak payroll number with firm wages can create a very different response from broad labour-market weakness. Gold’s usual relationship with yields is a useful framework, not a rule that every release must obey.
For the calendar and session context, use our economic calendar and forex market sessions tool. The New York time shown here is EST; UTC times already reflect the November daylight-saving change.
06 / Conditional playbook
Three routes. Clear conditions for each.
Bullish continuation: resistance becomes support
Trigger: an H1 or H4 close above $4,150, followed by a retest that holds the $4,145–4,150 area. A brief spike through the zone is insufficient. Next reference: $4,200–4,220, where the reaction needs a fresh assessment.
Invalidation: price closes back below the broken zone and cannot reclaim it. This invalidates that breakout attempt, even if the larger recovery remains intact. Avoid treating a failed trigger as permission to hold until a much more distant support.
Orderly pullback: buyers defend the recovery base
Trigger: a pullback into $4,060–4,075, followed by a reclaim and a higher low on the execution timeframe. Require evidence of demand instead of buying solely because price touches the band. Next references: $4,100, then $4,145–4,150.
Invalidation: sustained H1/H4 acceptance below $4,060 and a failed retest from underneath. That changes the role of the zone from potential support to potential supply.
Failed recovery: the market gives the breakout back
Trigger: a close below $4,060 followed by a failed reclaim. Next references: $4,000 first; only if that level fails do $3,920 and $3,870 become more relevant. A strong regain of $4,075 with a higher low would weaken this bearish continuation case.
Range alternative: if gold holds recovery support but repeatedly rejects $4,150, it can rotate inside a wide range instead of trending. The middle of that range usually offers a less clear structural entry than its boundaries. Waiting is a valid decision.
07 / Execution discipline
Plan the invalidation before the target.
A support band is not a universal stop-loss instruction. The appropriate invalidation depends on the setup, timeframe, spread and actual entry. Place the planned stop beyond the structure that makes the idea wrong, allow for normal fluctuations, and reduce the position size when the necessary stop distance grows.
For example, an illustrative entry at $4,080 with a structural stop at $4,055 has $25 per ounce of price risk; a $4,145 reference offers $65, or 2.6 times that distance before costs. This is an arithmetic example, not a current order. The trade still requires the stated trigger and may lose.
Before committing risk
- Confirm the quoted price on your own broker feed.
- Choose the execution timeframe before evaluating the signal.
- Check the event clock, spread and available liquidity.
- Calculate size using the broker’s actual contract specification.
- Do not widen the stop just to avoid accepting an invalidation.
08 / Follow the market
Use a fresh chart for a fresh decision.
The image above preserves the evidence used for this report. The interactive chart below updates separately and may already show a different price or structure. Reassess the thesis when a level breaks or an important release changes the backdrop.
Questions traders are asking
Gold analysis FAQ
What is the gold price outlook for 5 November 2026?
Our snapshot favours a conditional near-term recovery while $4,060–4,075 holds. A sustained breakout above $4,145–4,150 would strengthen continuation toward $4,200–4,220. A loss of recovery support followed by a failed reclaim would weaken that view.
Why has gold recovered this week?
Contemporaneous reporting associated the rebound with dollar weakness and fiscal uncertainty after the US midterms. The wider demand backdrop includes central-bank purchases and ETF investment, but interest rates and incoming US data remain important counterweights.
When is the next US jobs report?
The BLS schedules the October Employment Situation for 6 November 2026 at 08:30 Eastern, or 13:30 UTC. It includes payrolls, unemployment and earnings; forecasts are not the released figures.
Does weak payroll data always make gold rise?
No. The surprise relative to expectations, wage growth, revisions, the dollar, yields and positioning can produce a mixed or reversing response. Read the whole release and the market’s follow-through.
Are these levels live buy and sell signals?
No. They are dated analytical zones with conditional triggers. The captured price, hypothetical sizing example and scenario targets are not executable orders or promises of returns.
Sources and methodology
Prepared by the SS7TRADER Research Team. Our level selection and scenarios are original interpretations of the captured four-hour chart. The commentary and event figures are attributed below. We have not assigned probabilities, invented live indicator values or presented a price path as certain.
- TradingView, OANDA:XAUUSD — original chart capture, 5 November 2026, 06:53:06 UTC.
- Reuters via MarketScreener — 4 November gold rally and dollar context.
- Capital Economics — Hamad Hussain’s 4 November commentary.
- World Gold Council / Metals Focus — Q3 2026 demand release, 3 November.
- World Gold Council — Q3 outlook, 3 November.
- US Bureau of Labor Statistics — official November release schedule.
- TD Economics — dated 30 October consensus calendar; forecasts can change.
Original editorial cover generated with AI; not a photograph of SS7TRADER holdings. Chart screenshot and scenario diagram have different purposes and are labelled accordingly. Educational market commentary, not a personal recommendation or guaranteed forecast.