

Gold gave back its early-week rally, Bitcoin broke below $70,000 and the dollar gained ground against several majors. Friday’s bounces repaired part of the damage, but the key levels on the charts still separated a relief move from a broader reversal.
Week of 9–13 November 2026. Charts captured Friday, 12:11–12:18 UTC (17:11–17:18 PKT), before US producer inflation and the weekly close. Quotes are rounded where appropriate. Select any chart to enlarge it.
What moved the markets this week?
Monday, 9 November. Gold climbed toward $4,140 as the dollar softened in early-week trading. Oil fell sharply on de-escalation headlines. That backdrop did not hold through the rest of the week. CaixaBank Research’s 10 November market note.
Tuesday, 10 November. US October CPI rose 0.4% month over month and core CPI rose 0.3%. The release kept attention on US rates. Higher expected rates and a stronger dollar are a plausible explanation for part of the pressure on gold, EUR/USD and GBP/USD, alongside market-specific factors. BLS October CPI release.
Wednesday and Thursday, 11–12 November. Veterans Day shifted the Fed’s scheduled statistical releases to Thursday. By Thursday, selling had carried gold through $4,000 and the lower intraday highs in BTC and ETH were already visible. The UK’s first estimate put Q3 real GDP growth at 0.7% quarter over quarter, yet GBP/USD was still weak on our Friday chart. The gap between a domestic data print and the currency’s reaction is a reason to track the USD side of the pair. Fed calendar · ONS UK GDP.
Friday, 13 November. Gold bounced off Thursday’s lows, while BTC and ETH recovered from sharp intraday drops. US October PPI was scheduled for 13:30 UTC / 18:30 PKT, after our chart cutoff. The figures and Friday’s final moves belong to a later update. BLS November calendar.
Gold: the $4,000 break changed the structure
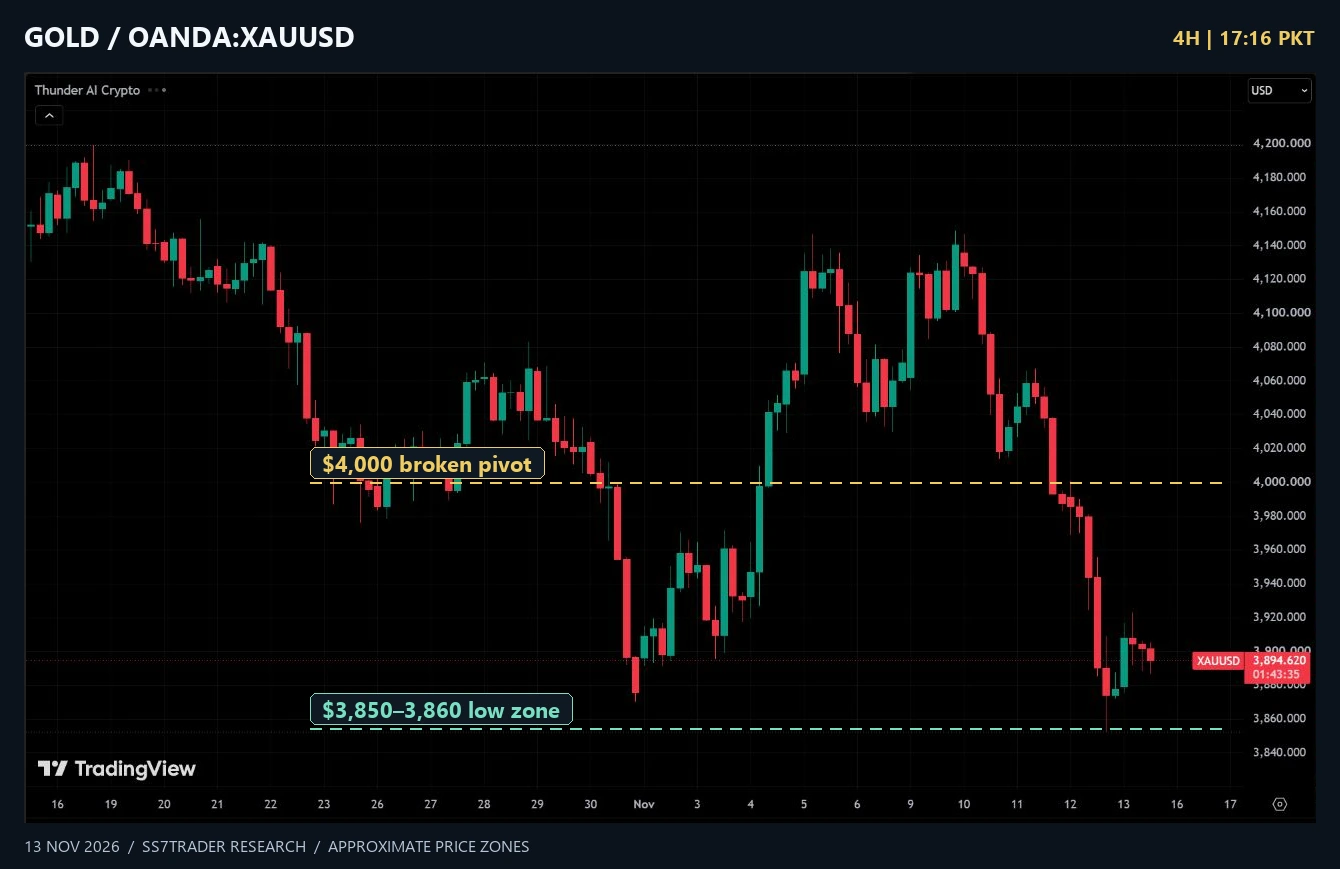
OANDA’s four-hour chart shows an early-week push around $4,140, a retreat through $4,000 and a Thursday low around $3,853. By Friday’s four-hour snapshot, gold was near $3,895. The week’s key change was the loss of the $4,000 area, which now gives readers a wider recovery checkpoint above Friday’s much closer levels.
On the 30-minute chart, Friday’s bounce reached the $3,915–3,925 area before momentum faded. The chart was near $3,893 at capture. $3,875–3,880 is the first downside zone in this view. Below it, Thursday’s $3,850–3,860 low area becomes the next reference. A recovery that holds above $3,925 shifts attention toward the prior $3,945–3,955 reaction and eventually $4,000.
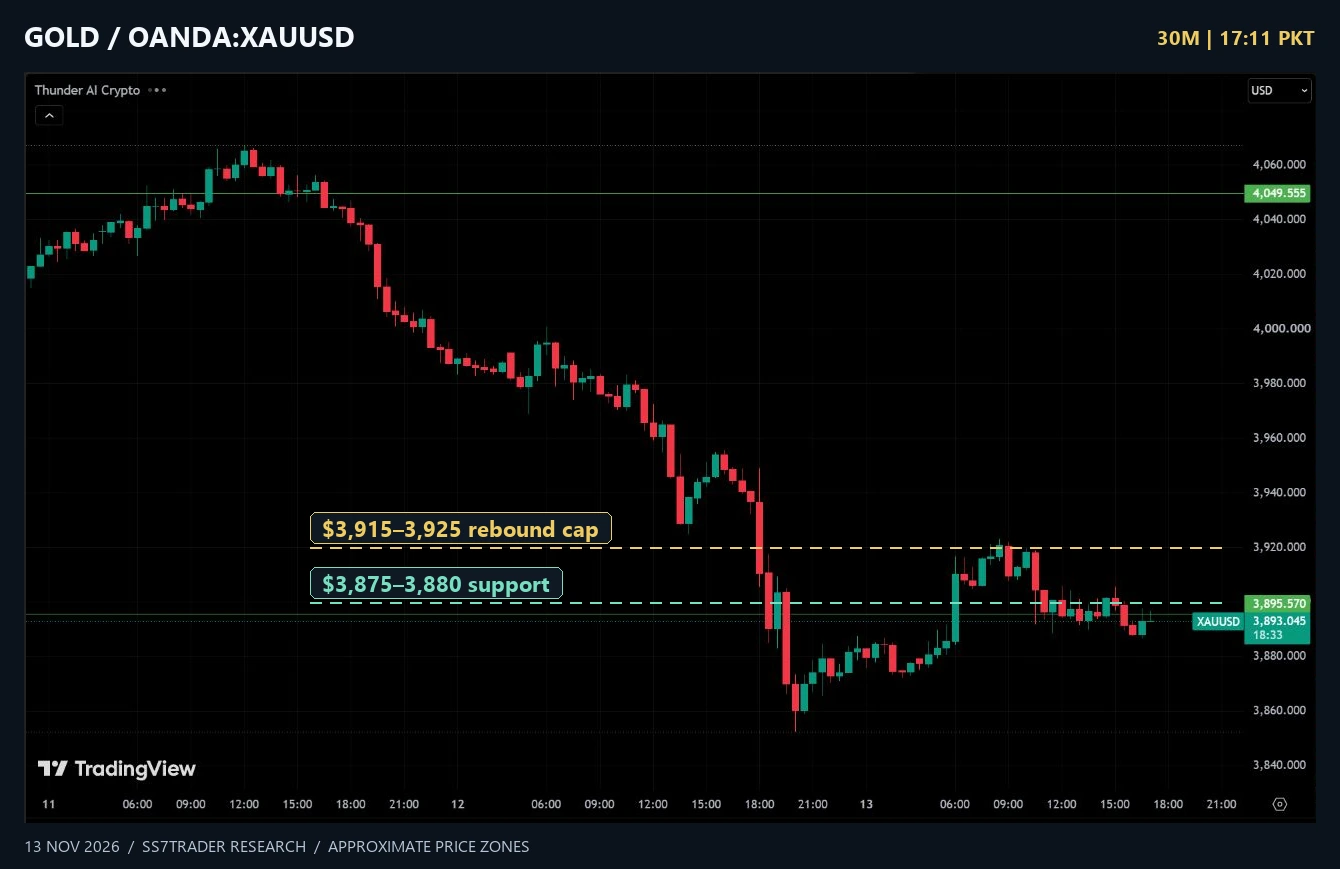
What would change our view? A sustained reclaim of the Friday rebound cap would weaken the immediate downside case. A return below the Thursday low would reinforce it. A move between $3,880 and $3,925 can still leave gold consolidating ahead of a fresh catalyst. The existing indicator overlay in the intraday capture is a separate visual aid. The dotted levels were added for this report.
Thunder AI Forex & Gold for MT5 covers scalping and intraday workflows, with optional on-chart entry, target and stop levels.
Crypto: BTC and ETH rebounded from fresh selloff lows
Bitcoin (BTC/USDT): $70,000 is the first reclaim
Bitcoin moved from the mid-$74,000s on the captured midweek chart through $72,000 and then $70,000. Binance’s rolling ticker recorded a 67,568 USDT low and a 5.36% 24-hour decline at 11:23 UTC. The later chart showed a rebound to about 69,460 USDT. These are distinct snapshots. The sharp bounce shows demand appeared after the low, while the lower highs above price still define the wider selloff. Binance market data.
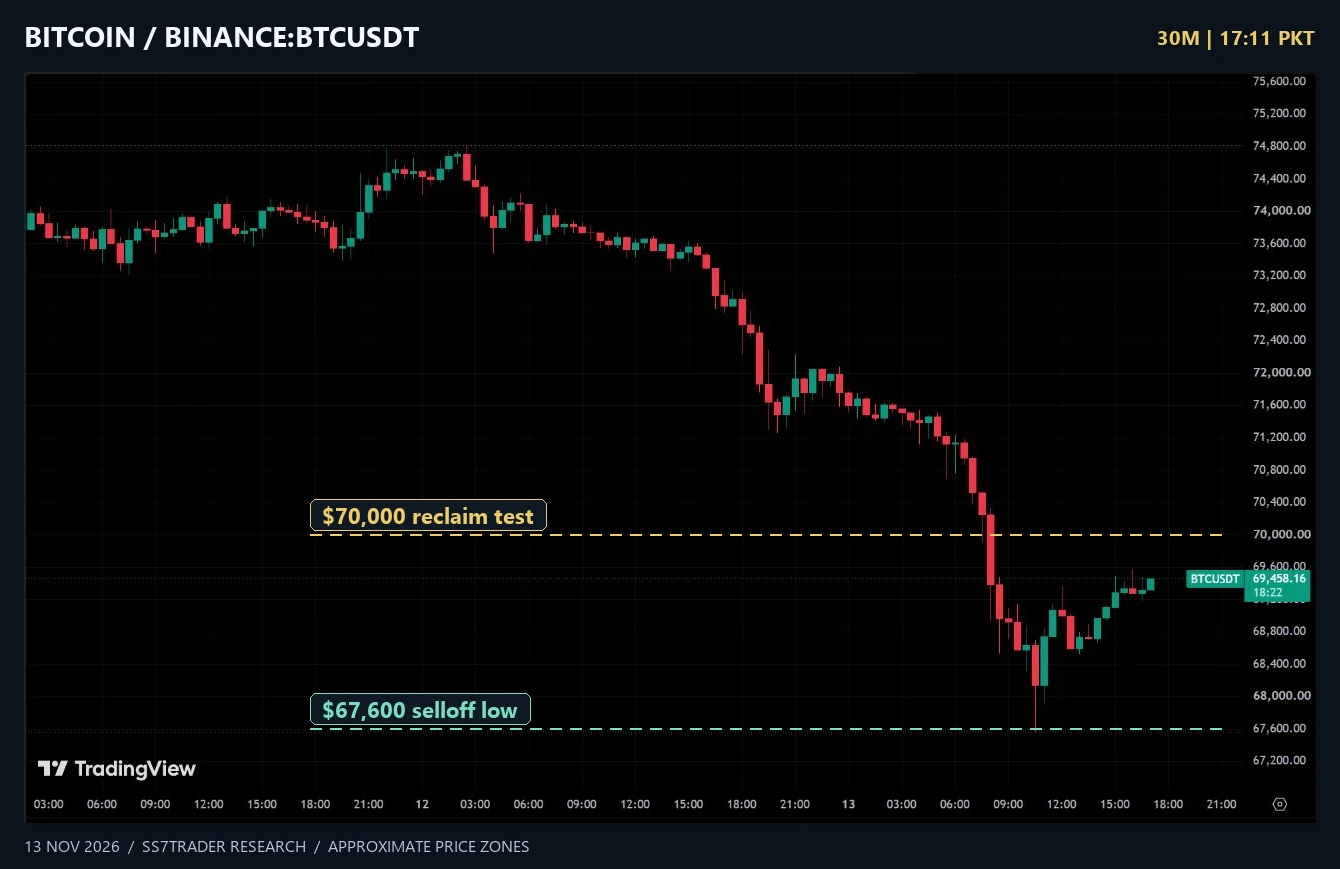
Holding back above $70,000 would bring the $71,200–72,000 breakdown area into focus. If sellers defend $70,000, the rebound base around $68,400–68,800 and the $67,600 low remain the downside checkpoints. The chart records spot prices in USDT.
Ethereum (ETH/USDT): $2,000 separates the bounce from the prior range
ETH fell from around $2,090 in the midweek window to a wick near $1,900, then rebounded toward $1,964 on the Friday capture. The fall cut through the earlier $2,000–2,020 shelf. A hold above that shelf would strengthen the recovery case. A failure around $2,000 keeps $1,930–1,940 and then $1,900 relevant.
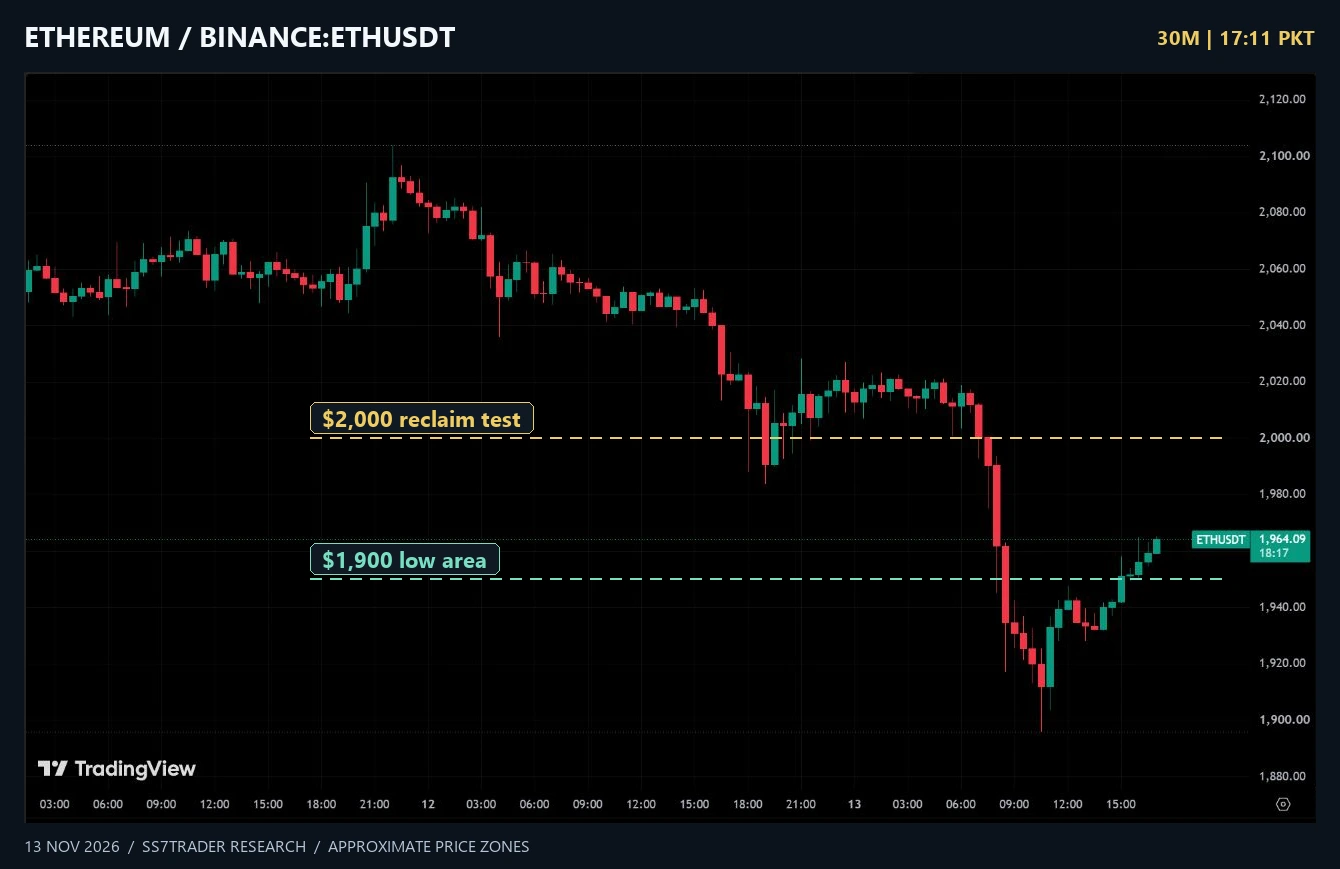
BTC and ETH broke down together in these captures. A stronger case for a broad crypto recovery would be both assets retaking their broken shelves. Explore Thunder AI Crypto for TradingView.
Forex majors: where the dollar move held
The same dollar theme showed up in different structures. EUR/USD, GBP/USD and AUD/USD were near their lower ranges. USD/JPY was testing a round-number ceiling while USD/CAD was already consolidating after its advance. Treating these as five independent exposures would understate their shared USD risk.
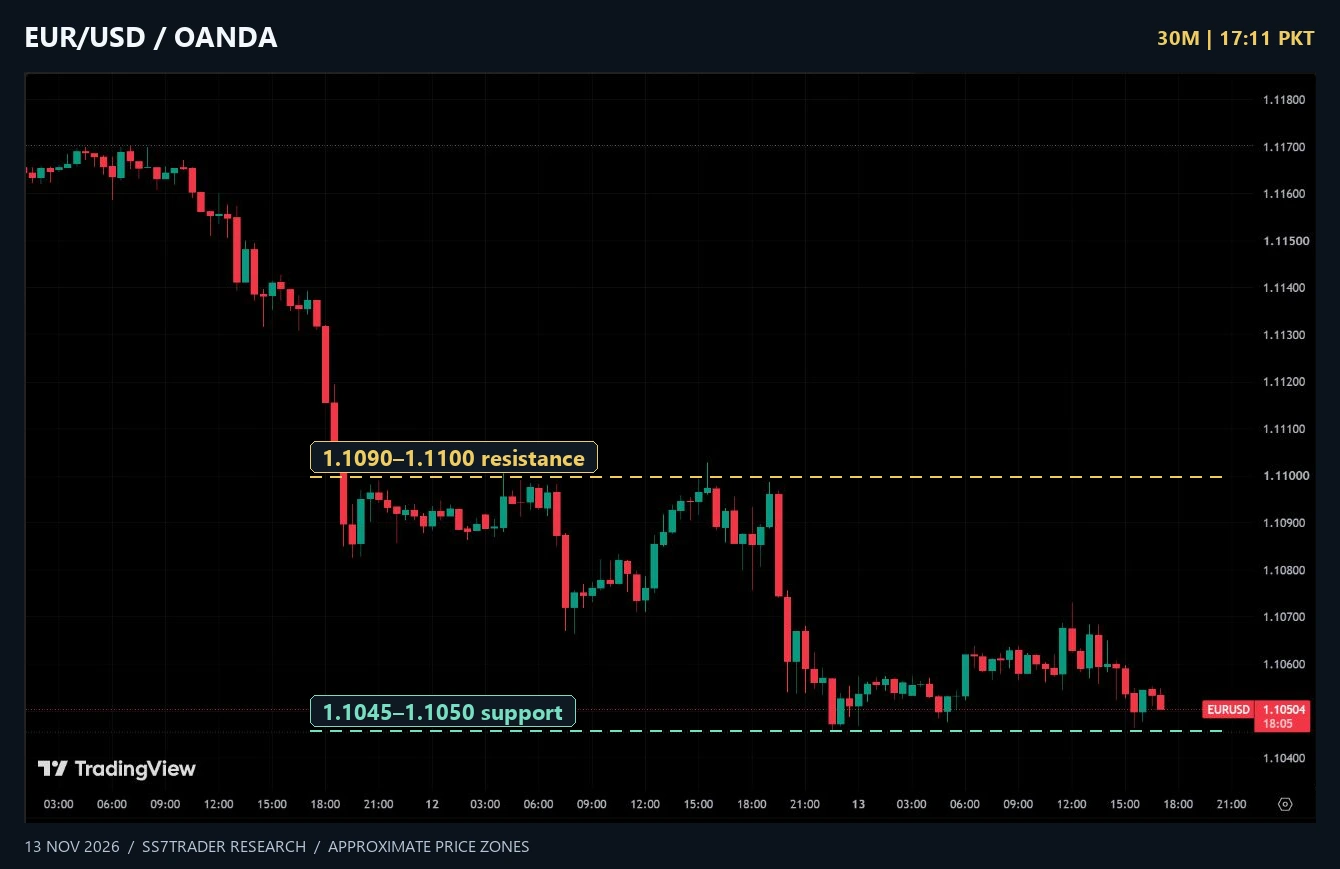
EUR/USD · 1.1050
The midweek fall from around 1.1170 left Friday price near 1.1045–1.1050. Holding that shelf can support a bounce toward 1.1070. A stronger recovery would reclaim 1.1090–1.1100. Below the shelf, 1.1000 is the next psychological reference.
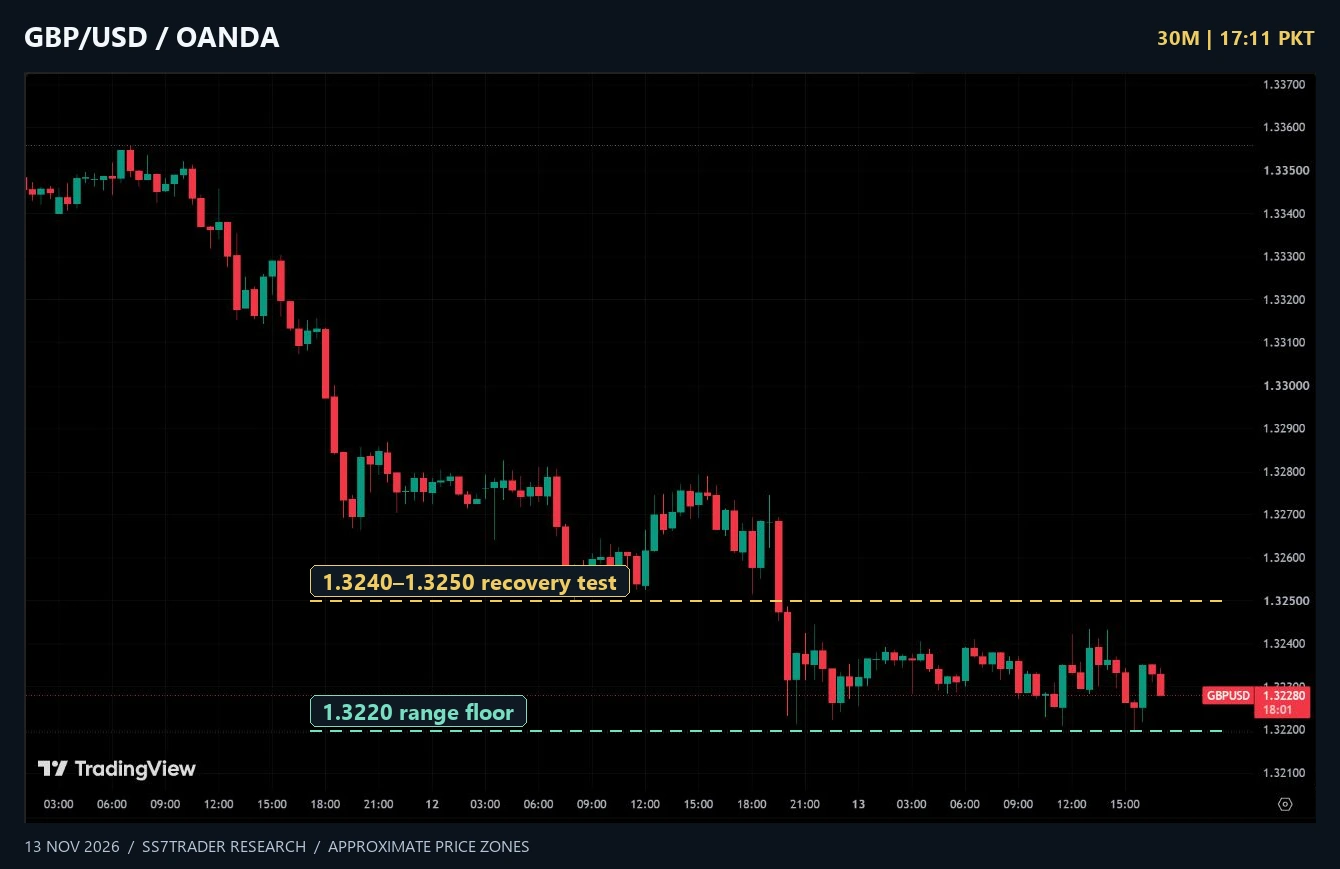
GBP/USD · 1.3228
Sterling fell from the mid-1.33s and settled into a tighter band. 1.3220 is the local floor. 1.3240–1.3250 marks the first recovery test, with 1.3270–1.3280 higher up. A renewed break through the floor would end the short consolidation.
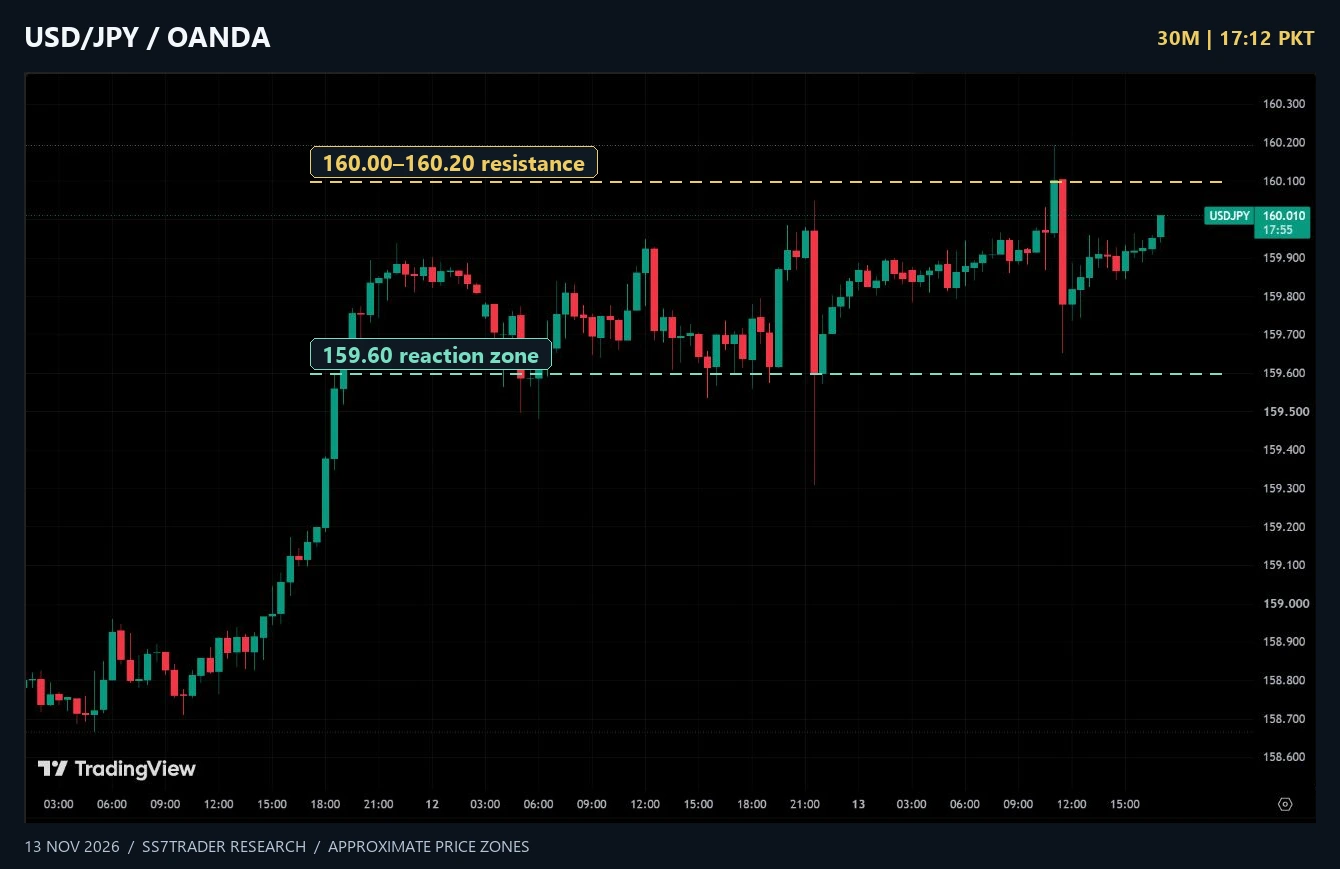
USD/JPY · 160.01
The pair advanced from around 158.70 midweek and repeatedly tested 160.00–160.20. A hold above the upper edge would extend the move. A rejection back below 159.60 would make the prior 159.30 reaction relevant. The quick reversals near 160 are visible in the candles.
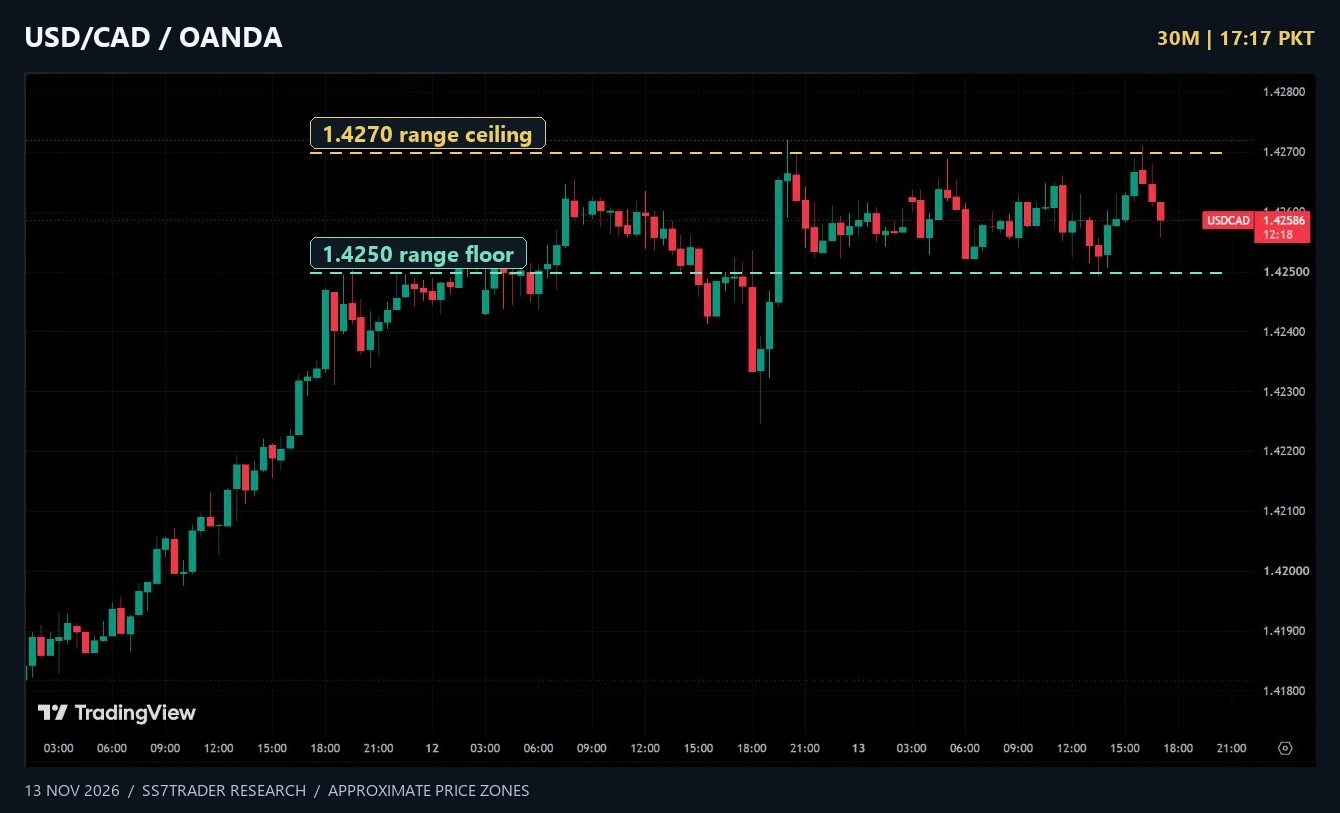
USD/CAD · 1.4259
The move from around 1.4190 slowed into a Friday range around 1.4250–1.4270. A sustained break above 1.4270 resumes the upward structure. Below 1.4250, the Thursday reversal near 1.4230 is a useful next reference. Watch crude alongside the USD because CAD can react to both.
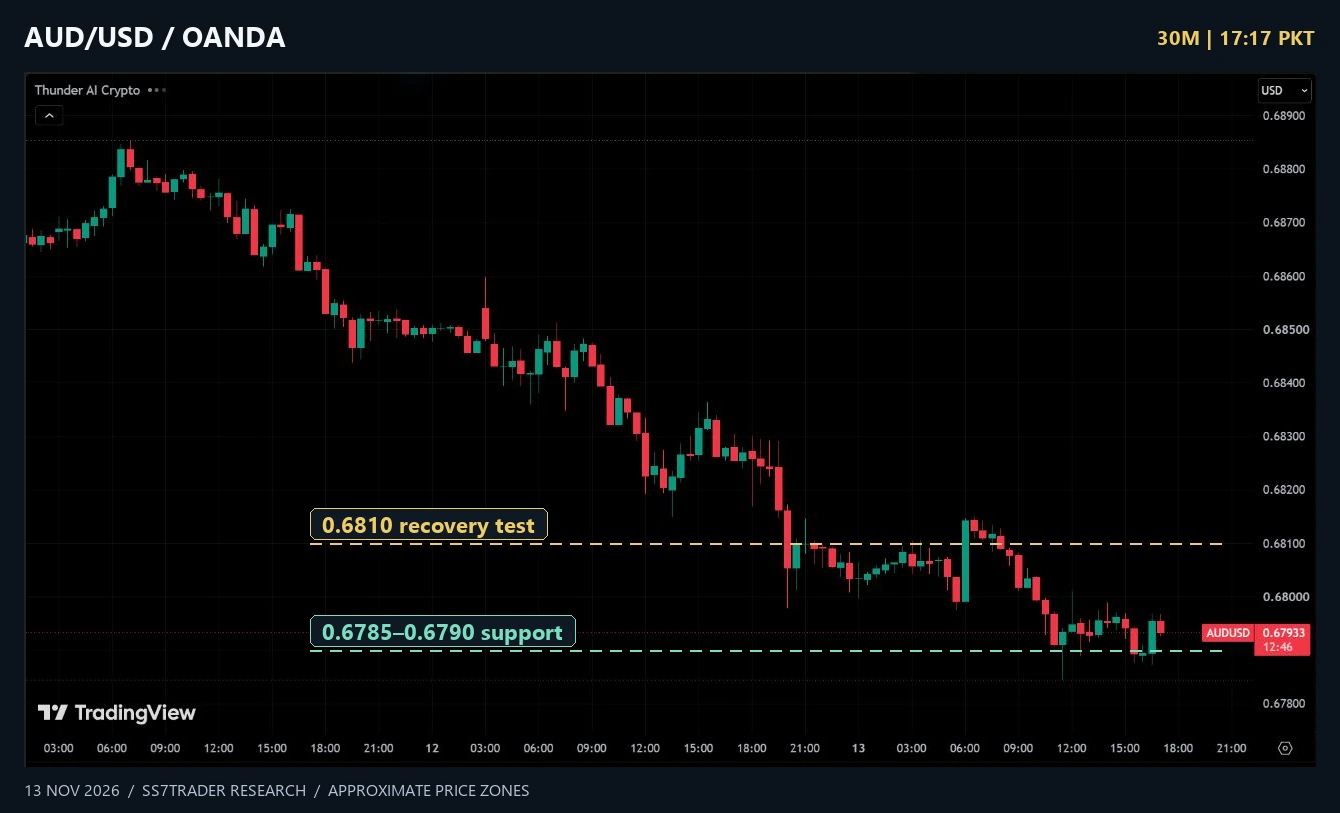
AUD/USD · 0.6793
The chart shows a sequence of lower highs from around 0.6880, with Friday testing 0.6785–0.6790. A bounce that retakes 0.6810 would ease immediate downside pressure. Continued rejection there would keep the lower shelf under scrutiny.
Levels and catalysts to carry into next week
| Market | Recovery or breakout | Downside test |
|---|---|---|
| Gold | $3,925 → $3,950 / $4,000 | $3,880 → $3,850–3,860 |
| Bitcoin | $70,000 → $71,200–72,000 | $68,400–68,800 → $67,600 |
| Ethereum | $2,000–2,020 | $1,930–1,940 → $1,900 |
| EUR/USD | 1.1090–1.1100 | 1.1045 → 1.1000 |
| GBP/USD | 1.3240–1.3250 | 1.3220 |
| USD/JPY | 160.00–160.20 | 159.60 → 159.30 |
| USD/CAD | 1.4270 | 1.4250 → 1.4230 |
| AUD/USD | 0.6810 | 0.6785–0.6790 |
The Fed lists US industrial production for Tuesday, 17 November at 14:15 UTC, and minutes of the October 27–28 FOMC meeting for Wednesday, 18 November at 19:00 UTC. A USD pullback alongside falling yields would help the recovery case in gold and EUR/USD. If yields rise and the dollar extends its move, watch which downside zones break first. Weekend crypto trades can reset BTC and ETH levels before Monday. Federal Reserve calendar · SS7TRADER economic calendar.
Broker and exchange partners
These are SS7TRADER referral links. We may earn a commission from eligible signups or activity. Availability, fees and account terms depend on your country and the provider.
Exness · Forex & GoldBinance · CryptoBitunix · CryptoCompare spreads, funding and withdrawal terms for the product you intend to use. Our Bitunix guide explains spot and futures account differences.
Frequently asked questions
Why did gold fall this week?
Gold reversed after an early-week rally as attention returned to US inflation, rates and the dollar. The chart shows the decisive loss of $4,000 and a test of the $3,850–3,860 area.
What level matters most for Bitcoin?
$70,000 is the first recovery test on the Friday snapshot. The selloff low near $67,600 is the lower reference if the bounce fails.
Which data are included in this report?
The report covers trading from 9 November through the Friday chart captures at 12:11–12:18 UTC. The captures precede US PPI and the weekly close.
Chart methodology: actual TradingView screenshots, OANDA for spot gold and Forex and Binance spot for crypto. SS7TRADER added the approximate support and resistance labels. Visible prices are captured observations. Levels can change after publication.